From: John Conover <john@email.johncon.com>
Subject: Re: Exposing my ignorance
Date: Thu, 6 Aug 1998 13:12:56 -0700
>
> Say, do you have any exemplary charts that strongly display fractal
> characteristics in the trading ranges among, for a single stock, periods of
> 4-5 hrs, 4-5 days, 4-5 months, 4-5 years, and 4-5 decades.
>
Sure. What one would want to do is display fractal characteristics at
all possible ranges of time, 1 day, 2 days, 3 days, and so on. Its a
formidable computational problem, (an exercise in combinatorics,) and
thats why we invented computers.
Since a fractal is defined as the cumulative sum of a random variable,
(ie., roll the dice, add what comes up to what we have, roll the dice
again, and add what comes up to what we have, and so on,) we can
simply work backwards subtracting the previous value from the current
value, for all values in time, to investigate the random process that
made the fractal. We would then want to look at the relationship
between values that are 1 day apart, 2 days apart, 3 days apart, and
so on.
Specifically, we want the statistics of how the values, at different
day scales, relate to each other, ie., the range of deviation at
different day scales, and the standard deviation at different day
scales.
If, and only if, it is a fractal, then the range will go up with the
square root of the day scale, and the standard deviation will remain
constant. (Actually, to be mathematically precise, fractals are a
whole family of such things-the range could go up on the n'th root of
the time scale. If it is true Brownian motion-the most common type of
fractal-it will be the square root, which is the hallmark signature of
a random process, with independent increments, and a Gaussian, or
Normal, distribution.)
If we compute such a data set from empirical data, we would want to
plot it on log-log paper, since the square root, (or n'th root,) would
plot linear-with the slope of the graph equal to the root, n. This is
called Hurst's rescaled range/scale analysis after the hydrologist
H. E. Hurst who invented it in the 1950's. (If rain happens randomly,
and we sum the rain into a reservoir, how high do we have to build the
dam such that it doesn't overflow-that's the problem that Hurst was
working on.) The slope of the graph is called Hurst's exponent.
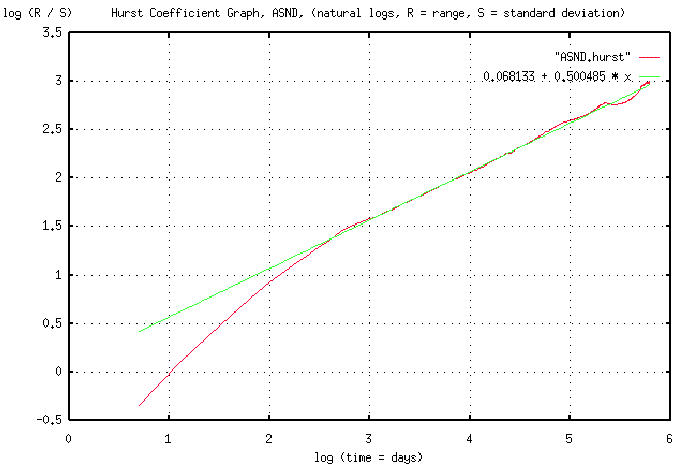
Attached is a graph of the R/S analysis for Ascend's (ticker ASND,)
stock value, (from 4 January, 1995 to 1 May, 1996,) with a best fit
linear approximation. (Note that the slope of the best fit linear
approximation is 0.500485. Exactly-to within 0.1%-what we would expect
from a fractal constructed by a random process with independent
increments, and a Gaussian distribution.) The graph offers very
compelling evidence that equity prices are, indeed, fractal in nature,
and the statistics of the fractal are constructed by a Brownian motion
type of process. It is in pdf file format.
John
--

John Conover, john@email.johncon.com, http://www.johncon.com/