From: John Conover <john@email.johncon.com>
Subject: Re: Exposing my ignorance
Date: Fri, 7 Aug 1998 15:13:02 -0700
John Conover writes:
>
> If, and only if, it is a fractal, then the range will go up with the
> square root of the day scale, and the standard deviation will remain
> constant. (Actually, to be mathematically precise, fractals are a
> whole family of such things-the range could go up on the n'th root of
> the time scale. If it is true Brownian motion-the most common type of
> fractal-it will be the square root, which is the hallmark signature of
> a random process, with independent increments, and a Gaussian, or
> Normal, distribution.)
>
> If we compute such a data set from empirical data, we would want to
> plot it on log-log paper, since the square root, (or n'th root,) would
> plot linear-with the slope of the graph equal to the root, n. This is
> called Hurst's rescaled range/scale analysis after the hydrologist
> H. E. Hurst who invented it in the 1950's. (If rain happens randomly,
> and we sum the rain into a reservoir, how high do we have to build the
> dam such that it doesn't overflow-that's the problem that Hurst was
> working on.) The slope of the graph is called Hurst's exponent.
>
Hurst's method is general, and can be used to analyze "chaotic," (ie.,
non-linear dynamical,) systems, also. There is mounting, although not
compelling, evidence that equity prices are chaotic phenomena. Chaotic
systems are an extension of fractal systems, and the two share many
common characteristics. A good way to think about it is that fractals
are a first order approximation to more complex systems, like those
that exhibit chaos.
The Stanford economist Brian Arthur has published a formal proof that
equity prices vacillate (formally, bifurcate,) between fair market
prices, and speculative escalation. Further, this vacillation will be
cyclical, indicating that the system is governed by what is called an
"attractor." The proof concludes that the attractor has fractal
characteristics, ie., it appears at all scales, or levels of
complexity-eg., it is an infinitely complex system-making the
attractor what is termed a "strange attractor." If this is true,
Hurst's method should lend some empirical insight into the phenomena.
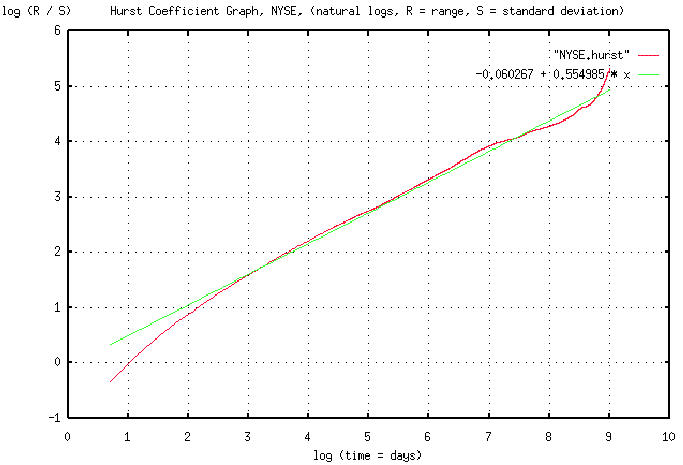
Such analysis requires enormous amounts of data. The attached is a
graph of the Hurst exponent for the daily New York Stock Exchange
Composite, inclusively between 3 January, 1966 and 30 July, 1998,
using the data from http://www.nyse.com/public/market/2c/2cix.htm. The
data for the graph was generated by the tshurst.c program, and took a
little over 13 hours to execute. Overlaying this graph is a least
squares linear approximation to the graph. The graph is in pdf format.
The "ripples" ie., the cyclic phenomena, of the strange attractor can
be seen as the difference between the two graphs. What this means is
that the NYSE is not entirely a random process-there are cyclic
correlations where the probability of prediction rises above 50% to
approximately 60%. And that is exploitable. The largest cycle occurs
at about 4.33 year, (log (1062) days = 7 on the graph-there are 253
trading days in a year,) intervals, (why, no one knows,) and one of
these cycles started at about early October, 1969. The implications
are:
1) Prediction based on near term data is very unreliable, with a
probability of success of 50%-near term being a year, or so.
2) To get an idea of what the market will do in the near future,
there is about a 60% chance that it will be repeating what it did
4.33 years ago. The reason for this is that where the Hurst
exponent (ie., the slope of the graph,) is 0.5, no predictability
exists-however, during the up-slope of the ripples, the graph
steepens, to about a 60% slope, meaning that a 60% predictability
exists. When the slope of the graph goes below 0.5, the situation
is anti-cyclical, (ie., there is a 60% chance that the market will
be doing the opposite of what it was doing.)
3) The ripples in the graph occur at all scales, but the change in
slope is less pronounced, meaning that the predictability
decreases below 60%.
John
--

John Conover, john@email.johncon.com, http://www.johncon.com/