From: John Conover <john@email.johncon.com>
Subject: Re: Exposing my ignorance
Date: Fri, 7 Aug 1998 15:29:25 -0700
John Conover writes:
>
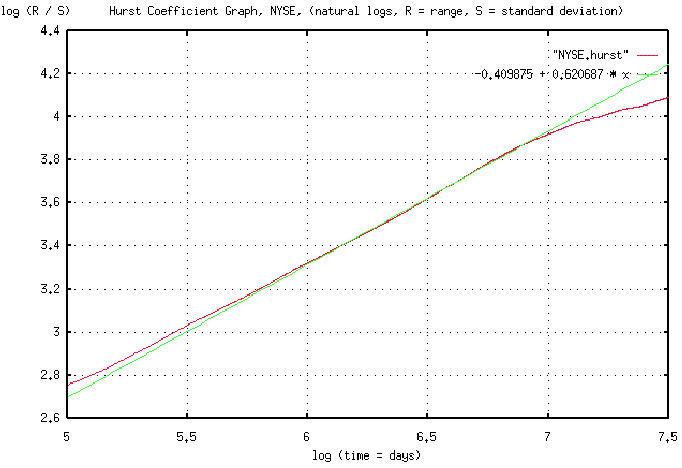
> Such analysis requires enormous amounts of data. The attached is a
> graph of the Hurst exponent for the daily New York Stock Exchange
> Composite, inclusively between 3 January, 1966 and 30 July, 1998,
> using the data from http://www.nyse.com/public/market/2c/2cix.htm. The
> data for the graph was generated by the tshurst.c program, and took a
> little over 13 hours to execute. Overlaying this graph is a least
> squares linear approximation to the graph. The graph is in pdf format.
>
Attached graph is a finer resolution in the vicinity of log (1062
days) = 7 of the previous graph showing a slope of 62.0687%. Thus,
there is a 62% chance that the market will be doing today, what it was
doing 4.33 years ago. The next graph will show the fractional error
between the linear approximation and the Hurst exponent. It turns out,
that the correlations are very visible in the NYSE Composite's graph,
(now that we know what we are looking for,) with some interesting
consequences-that will be the final graph.
John
--

John Conover, john@email.johncon.com, http://www.johncon.com/