From: John Conover <john@email.johncon.com>
Subject: Re: Exposing my ignorance
Date: Fri, 7 Aug 1998 15:48:11 -0700
John Conover writes:
>
> Attached graph is a finer resolution in the vicinity of log (1062
> days) = 7 of the previous graph showing a slope of 62.0687%. Thus,
> there is a 62% chance that the market will be doing today, what it was
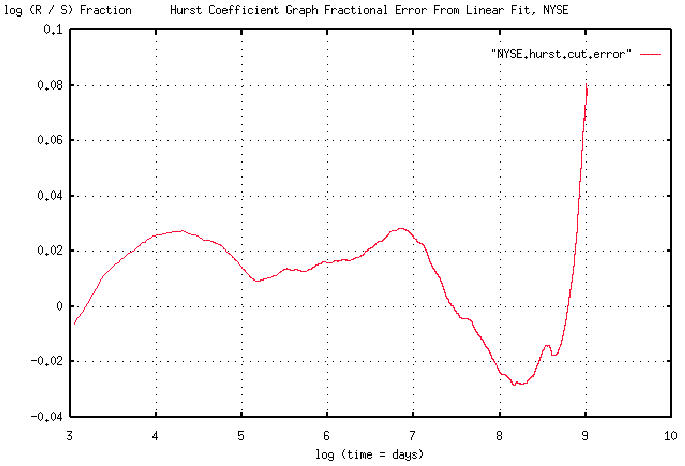
> doing 4.33 years ago. The next graph will show the fractional error
> between the linear approximation and the Hurst exponent. It turns out,
> that the correlations are very visible in the NYSE Composite's graph,
> (now that we know what we are looking for,) with some interesting
> consequences-that will be the final graph.
>
The attached graph is the fractional error between the least squares
best fit linear approximation and the Hurst exponent for the NYSE
Composite in pdf format. It was derived by subtracting the two graphs,
and plotting the percentage difference, (which is about +/- 2% on a
log scale.) The characteristics of the strange attractor are clearly
visible. Note that it is a log-log plot, so the bifurcations would
would tend to scale linearly. At least 2, (and possibly the beginning
of the third,) are clearly visible. The linear distance between the
peaks should be the same, (at about 2.5 major grid units.)
This suggests that the time series of the daily NYSE Composite could
"chopped" into 4.33 year intervals, and the correlation clearly seen.
That will be the next graph.
John
--

John Conover, john@email.johncon.com, http://www.johncon.com/