From: John Conover <john@email.johncon.com>
Subject: Re: Exposing my ignorance
Date: Fri, 7 Aug 1998 16:43:07 -0700
John Conover writes:
>
> This suggests that the time series of the daily NYSE Composite could
> "chopped" into 4.33 year intervals, and the correlation clearly seen.
> That will be the next graph.
>
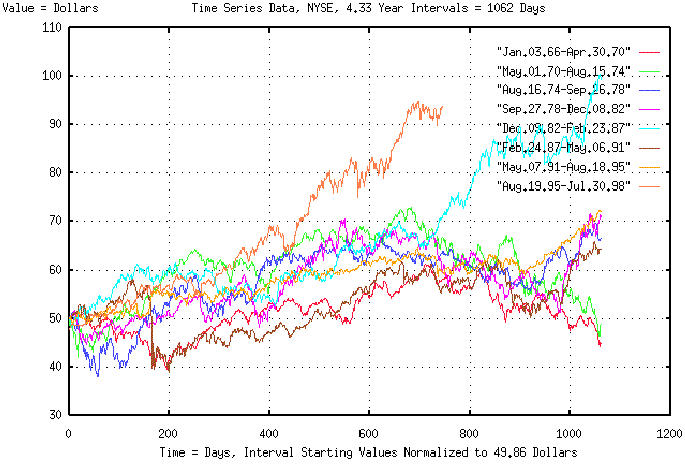
The attached graph, in pdf format, is a graph of the NYSE Composite,
from 3 January, 1966 to 30 June, 1998, by the day, chopped into 4
year, 4 month segments, (ie., strange attractor "cycles.") The data in
each segment was multiplied by a constant such that the graphs all
start at the same value, 49.86 dollars-the value of the NYSE Composite
on 3 January, 1966, (ie., they were normalized so that they could be
overlayed.) The cyclic phenomena of the strange attractor can be
clearly seen in the correlation between the intervals. It is an
interesting graph.
Let me make some qualifications. Fractal science is less than a
century old, but we have a robust mathematical infrastructure to
support it. The science of chaos is less than a quarter of a century
old, and the implications of the science are not clearly
understood. That equity prices and markets could have chaotic
characteristics is even newer-less than a few years-with almost no
mathematical or empirical infrastructure-it would probably be
appropriate to consider it an interesting, but unproven, theory.
Note, from the attached graph, that all 4.3 year intervals of the NYSE
Composite tend to increase for 700 days, or so, then all except 2
decrease for about 300 days. The two "abberations" are the current
interval, (which has not concluded yet-but seems to have an unusually
"high" peak,) and the interval preceeding 24 February, 1987, which,
also, had an unusually "high" peak. About 200 days later, the interval
lost 22% of its value in October of 1987-and then followed the other
intervals, fairly closely. Note that Octobers seems to be the
"natural" start of the "cycles" which would put the peaks in the
middle of the graph.
I'm reluctant to do it, but lets see how it works out as a test of
chaotic strange attractor theory. It would seem that there is about a
60% chance of a 30% market correction, or so, in the next 200 days, or
maybe a little more. Note the qualifications mentioned two paragraphs
back-and remember that 60% does not mean a certainty.
John
--

John Conover, john@email.johncon.com, http://www.johncon.com/