From: John Conover <john@email.johncon.com>
Subject: Re: Electronic Components Shipments Industrial Marketplace
Date: Wed, 14 Oct 1998 21:05:33 -0700
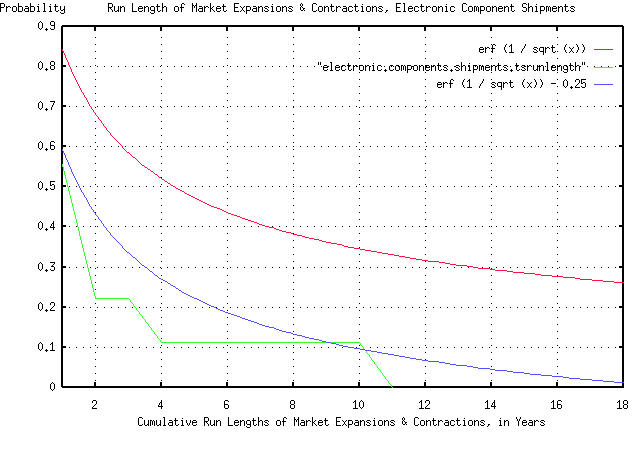
John Conover writes:
>
> There is one remaining question. What happens if we want to know the
> characteristics of the duration of the run lengths of market
> expansions and contractions in years, instead of months?
> Astonishingly, it doesn't make any difference! The same rule holds
> irregardless of the time scale-for which, I will offer compelling
> evidence.
>

As counter intuitive as that sounds, it is simple to show that it is,
indeed, true. Suppose I take the original data from the Department of
Commerce, and only look at the data by years, ie., only look at the
values of the month, say January. I had 181 data points, that
contained 16 January values. I have to offset the graph to account for
there being only 16 data points, as before, by 1 / sqrt (16) = 1 / 4 =
0.25. The graph is compelling:
As before, all the graph means is that if you want to find the chances
of the duration of an industrial market expansion or contraction being
longer than, say four years, you find 4 on the x axis, move up to the
graph, and left to the y axis, and read about 0.5 = 50%.  There are
three graphs displayed. The "real" graph is erf (1 / sqrt (t)), and is
the graph that should be used. The graph erf (1 / sqrt (t)) - 0.25 is
what we would expect to see if our data was 16 years, and the
remaining graph is the empirical data from the Department of Commerce,
which consisted of 16 years. All in all, a respectable "fit" of
empirical data to our theoretical model-particularly considering the
data set size was only 16 data points.

So, the assumption that our model of the duration of expansion and
contraction intervals in industrial markets can be calculated as
having a probability of happening of 1 / sqrt (t) seems to be
intuitively justified, irregardless of whether we are talking in
months or years.

        John

--

John Conover, john@email.johncon.com, http://www.johncon.com/