From: John Conover <john@email.johncon.com>
Subject: Fractal "bubbles", Re: Business News from Wired News
Date: 30 Dec 1998 05:37:56 -0000
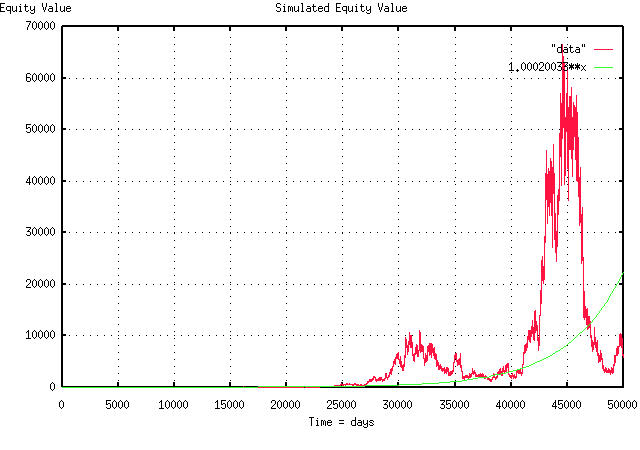
If you don't believe fractals can have bubbles, look at the attached
PDF graph. What I did here was toss a thousand coins in the air,
(well, actually, I used a computer's random number generator,) and
added the difference between the number of heads and tails, to the
current value of the stock, to get the stock's value for the next
day. I did this 50,000 times, to simulate an equity's value, over
time-about 200 years worth. (In technical jargon, I used the
cumulative sum of a binomial distribution to simulate a fractal with
Gaussian/normal distributed marginal increments, eg., a simple "random
walk" model.)

Ten of the thousand coins had heads on both side, giving an average
marginal return of 1.0004 per day, with a volatility of marginal
return of 2% per day, which is the average of all stocks in the
NASDAQ, NYSE, and AMEX for the century, (ie., the likelihood of an up
movement, P, in the stocks value on any day is 51%, the avg = 0.0004,
and the rms = 0.02, and P = ((avg / rms) + 1) / 2, where avg = rms^2.)
This means that the stock's gain in value is 1.000200033 per day, or
about 0.02% per day-in case you want to relate it to a compound
interest scenario.

I let the simulation run until I got a nice, big, bubble-beginning at
about 42,000 days, and ending at about 47,000 days, or a bubble run
length of about 20 years. During this time, the fractal was about an
order of magnitude above "where it should be", ie., its real average,
which is the smooth line in the graph, (the green graph, if you have
color.)

        John

BTW, most bubbles in the simulation lasted about 4 years-some less,
some more, depending on how one judges what a bubble is-I just let the
simulation run long enough to get a big one to impress you. The
chances of a big one increase with the square root of time. The
chances of a zero crossing of the real average go down with the square
root of time, and the chances of finding a long run length bubble goes
down with the reciprocal of the square root of the bubble's run
length. The deviation of the fractal from its real average diverges
with the square root of time, and on average, the fractal's maximum
divided by its minimum will be a factor of two in any year, and the
range, ie., maximum - minimum, scales with the square root of time,
for values larger than a year. The stocks on the NASDAQ, NYSE and AMEX
have these characteristics to many orders of magnitude precision, (but
there are minor discrepancies, so don't jump to conclusions-its not
exploitable, anyhow.)
--

John Conover, john@email.johncon.com, http://www.johncon.com/