From: John Conover <john@email.johncon.com>
Subject: Re: Fractal "bubbles", Re: Business News from Wired News
Date: 30 Dec 1998 07:30:56 -0000
John Conover writes:
>
> BTW, most bubbles in the simulation lasted about 4 years-some less,
> some more, depending on how one judges what a bubble is-I just let the
> simulation run long enough to get a big one to impress you. The
> chances of a big one increase with the square root of time. The
> chances of a zero crossing of the real average go down with the square
> root of time, and the chances of finding a long run length bubble goes
> down with the reciprocal of the square root of the bubble's run
> length. The deviation of the fractal from its real average diverges
> with the square root of time, and on average, the fractal's maximum
> divided by its minimum will be a factor of two in any year, and the
> range, ie., maximum - minimum, scales with the square root of time,
> for values larger than a year. The stocks on the NASDAQ, NYSE and AMEX
> have these characteristics to many orders of magnitude precision, (but
> there are minor discrepancies, so don't jump to conclusions-its not
^^^^^^^^^^^^^^^^^^^^^^^^^^^^^
^^^^^^^^^^^^^^^^^^^^^^^^^^^^^
^^^^^^^^^^^^^^^^^^^^^^^^^^^^^
> exploitable, anyhow.)
>
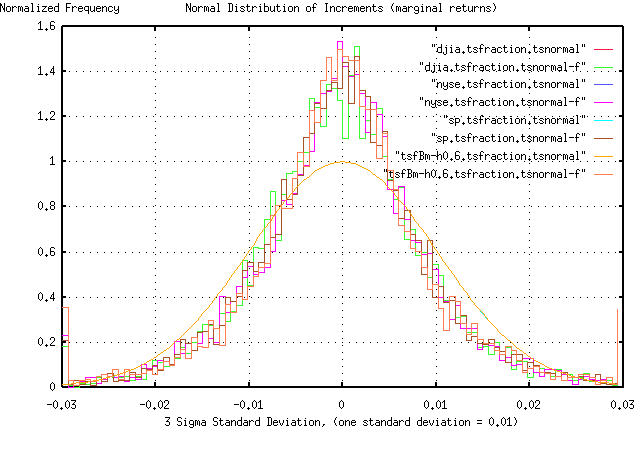
So, what are the minor discrepancies? Attached is a PDF graph of the
frequency distribution of the daily marginal returns for the NYSE,
DJIA, and S&P 500, indices for the last 27 years. If these had the
frequency distribution of a random walk fractal, they would be a
perfect Gaussian/normal bell curved distribution. Although it is
close, it is not. There are more small fluctuations than can be
accounted for, less moderate ones, and more big ones. The smooth line
is a least squares best fit Gaussian/normal frequency distribution to
the data. The 3 rough lines are the data.
What are the consequences? There is little consequence created by
there being more small fluctuations than can be accounted for. Too few
moderate fluctuations, also, have few consequences-it tends to lead to
volatility predictions that are very slightly conservative, (ie.,
stocks would have less volatility than one would estimate.) That there
are more big "hits" in a portfolio value can be a significant issue-if
it were a true Gaussian/normal distribution, three sigma hits would
occur, on average, every 741 trading days. The attached graph states
that this is optimistic by about a factor of two, (ie., they would
occur about twice as frequently as calculated.)
For the casual investor, such precision issues can probably be
disregarded, but to the likes of derivative fund managers, (who make
their living off of Black-Scholes' concepts which depends on it being
a perfect Gaussian/normal curve,) it can be the kiss of death. Here's
why. In derivative hedge funds, volatility is leveraged by investing
in multiple volatile financial instruments, concurrently, in such a
manner that the fund's volatility is less than any of the individual
financial instrument's volatility, (to an EE, it is like adding noisy
voltage sources together-the DC adds linearly, the noise root mean
square, so you end up with more DC, and less noise, at the same time.)
That's why they are called hedge funds-they are not as volatile as
what one is trying to hedge. What fund operators depended on is
knowing the likelihood of a big hit in ANY financial instrument in the
portfolio, quite precisely-two or more big hits occurring at the same
time, and he is probably out of business-having to liquidate to cover
losses, (this is what happened in August/October this year to several
hedge funds.)
Bear in mind that the the three sigma hits account for only 0.1% of
fluctuations, and the theory agrees with metrics to within a factor of
two, on the 0.1%, (there were 14 in the last 27 years-theory says
there should have been 7, out of the 6905 daily fluctuations.)
So, what causes the discrepancy with theory? There is a lot of
speculation on that-but no one really knows. One suggestion is that
there is a structural issue, (ie., regulation issue, political issue,
or something,) that causes modulus 4 years, minus 1, (in this
century-we just had one,) to be a down year with a negative glitch in
the last half of it, lowering the entropy, (ie., making the markets
less random than the theory says they should be.) But if this is true,
why in off election years, instead of election years? What structural
issue occurs only on modulus 4 years minus 1?
Yet another reason offered is that day-to-day fluctuations in equity
values are not a 50/50 probability for an up, or down movement, ie.,
there is persistence, (ie., there is a slight propensity for market
movements to do tomorrow what they did today.) A detailed analysis of
the attached graph would say that instead of a 50% chance of an up
movement tomorrow, there is a 58%, but only if it moved up today,
(likewise for down movements.) This is a fractal, also, but a more
sophisticated one, (one with a Hurst exponent of 0.58,) which occur
frequently in nature, also, (mountain ranges have Hurst exponents of
about 0.6, for example.) The proponents of this argument point out
that the 50/50 assumption is not quite right-the assumption that
people make arbitrage decisions by disregarding all of the past is
just not intuitive-since people do remember whether they got burned on
a stock yesterday, which would influence their decision today, (the
persistence would just decay exponentially at a 0.58 * 0.58 ... rate
in time.) This would account for the low entropy we see in the
markets, and the increase in the number of three sigma hits. It, also,
has a nice mathematical infrastructure, in that instead of adding
volatility root mean square, it would be (a^1.72 + b^1.72 ...)^0.58
instead of (a^2 + b^2 ...)^0.5 as in the random walk model. But it
doesn't explain the 4 years minus 1 phenomena, which the fractalists
point out is on feeble metrics and empiricals-there were only 23 of
them this century-and fractal analysis requires a lot of data. More
than we have acquired in the century, (remember the adage quoted in
early 1997 that years that end in 7 are down years? All such years in
the century were down years, except 1997, as it would turn out.)
The most sophisticated explanation is that there are chaotic, (ie.,
non-linear dynamical system,) effects. Very elaborate simulation
techniques, (from the Santa Fe Institute, using neural networks, with
each node representing an investor doing equity value arbitrage,) have
produced equity values that have the modulus 4 year minus 1 phenomena,
and the shape of the glitches every 4 years look remarkably like what
is seen in the stock markets. Unfortunately, if it is a chaotic
system, it is doubtful that a deterministic causality, (ie., cause and
effect,) could ever be found to explain the phenomena-many argue it to
be theoretically impossible. So, although it may be intellectually
satisfying, it may be difficult, or impossible, to exploit. (However,
short term probabilistic forecasts, may be possible, but like the
weather, long term forecasts are not seen as being viable.)
The modeling must be seen in a different perspective, however; with a
simple random walk fractal, a more sophisticated fractal model with
persistence, and a chaotic model, all being a continuum-the formulas
used are all related. Strike the non-linear terms from the chaotic
model, you have a fractal model with persistence. Set the persistence
to zero, and you have a random walk model.
John
--

John Conover, john@email.johncon.com, http://www.johncon.com/