From: John Conover <john@email.johncon.com>
Subject: Re: Fractal "bubbles", Re: Business News from Wired News
Date: 30 Dec 1998 08:22:58 -0000
John Conover writes:
>
> BTW, most bubbles in the simulation lasted about 4 years-some less,
> some more, depending on how one judges what a bubble is-I just let the
> simulation run long enough to get a big one to impress you. The
> chances of a big one increase with the square root of time. The
> chances of a zero crossing of the real average go down with the square
> root of time, and the chances of finding a long run length bubble goes
> down with the reciprocal of the square root of the bubble's run
> length. The deviation of the fractal from its real average diverges
> with the square root of time, and on average, the fractal's maximum
> divided by its minimum will be a factor of two in any year, and the
> range, ie., maximum - minimum, scales with the square root of time,
> for values larger than a year. The stocks on the NASDAQ, NYSE and AMEX
> have these characteristics to many orders of magnitude precision, (but
> there are minor discrepancies, so don't jump to conclusions-its not
> exploitable, anyhow.)
>
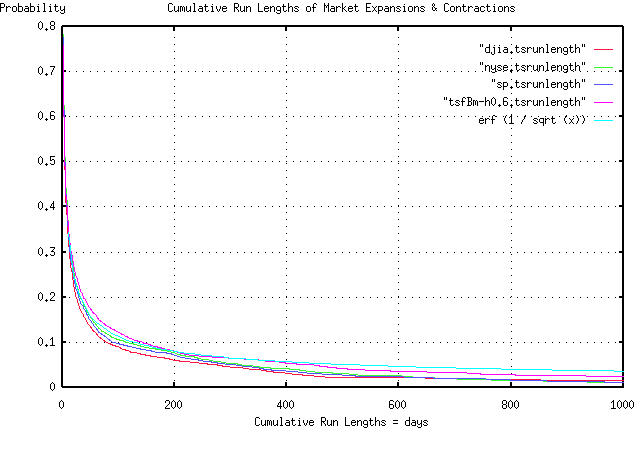
Since bubbles started this diatribe, and since I had the daily NYSE,
NASDAQ, and AMEX historical data loaded, I made a PDF graph of the
bubble run lengths, for all stocks, in all indices, for the last 27
years. The graph includes the run lengths of the three equity markets,
the run lengths of a simulated fractal with a 60% day-to-day
persistence, (made with the tsfBm program-I should have used 58%, but
60% is close enough,) and the run lengths of a theoretical random walk
fractal, which would be erf (1 / sqrt (t)).
The graph covers run lengths of less than 1,000 trading days, (about 4
calendar years.) The way you use it, for example, is to find the
probability of a bubble's run length being 100 days, or greater, (on
the x-axis,) which would have a probability of 0.1, or about 10%, on
the y-axis.
What this means, is that if a bubble started, say, 50 days ago, the
chances of it continuing for at least 50 more days would be about 10%.
Of interest is the chances of the bubble continuing for more than a
thousand days, (four years, or so,) at about 3%. Note that only 50% of
the bubbles last more than 4 days. 10% more than a hundred days, and
3% more than a thousand days. Point? Look at how quickly the graph
falls, initially, and how slow the tails of the distributions fall off
after about a month, or so.
Notice, also, how close the graphs of the empiricals are to the
simulated, and theoretical graphs-erf (1 / sqrt (t)) is a theoretical
graph, for an infinite data set. To accommodate a data set size of
6905, which was used for the empiricals, subtract the constant 1 /
sqrt (6905)) = 0.012 from erf (1 / sqrt (t), and the empirical graphs
agree very well with the theoretical and simulated values.
John
BTW, if one has an intuitive understanding of how the tails of a
Gaussian distribution fall off, and if that intuitive understanding is
applied to a distribution like erf (1 / sqrt (t)), it will lead to
significant errors. An intuitive understanding of the next to the last
paragraph is kind of important when dealing with bubbles.
--

John Conover, john@email.johncon.com, http://www.johncon.com/