| john@email.johncon.com |
| http://www.johncon.com/john/ |
|
|
|
||
The Case For Stereo Headphones |
|||
Home | John | Connie | Publications | Software | Correspondence | NtropiX | NdustriX | NformatiX | NdeX | Thanks
|
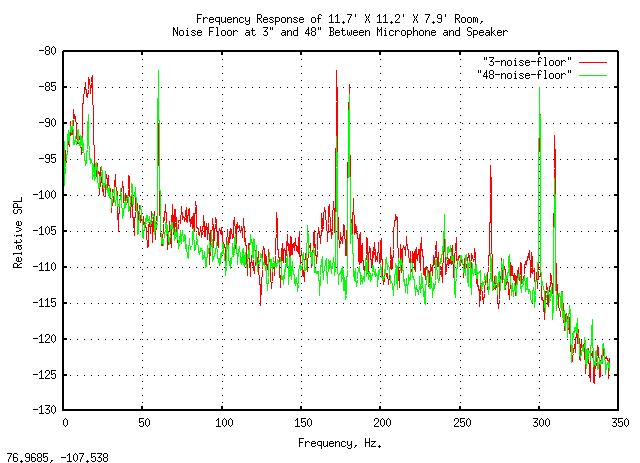
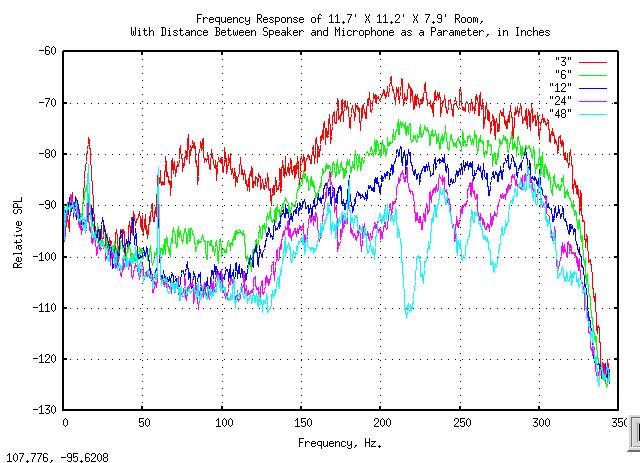
There is a reason musicians and sound/recording/mixing engineers often prefer headphones over speakers-room acoustics are an insurmountable problem. As a heuristic explanation, if you put a speaker in a room, it generates sound waves and the sound waves are reflected off of the walls, which are in turn added to the speaker's sound waves-depending on how far the reflected waves have traveled, they either increase the sound pressure level, (SPL,) from the speaker at some point in the room, or decrease it. (For those that remember basic high school trigonometry, it is adding two sine waves of the same frequency, but different phases-the phase is dependent on distance between the speaker and the point, and the distance the reflected wave traveled-including to a reflecting wall, and from the wall to the point.) Note that it will be different for the different walls, and at different points in the room-a plot of the sound intensity throughout the room will show all of the standing waves at each point, which varies with frequency. Analytically, it is intractable. For those wishing to pursue analytical solutions, see Room Acoustics, With Associated Fundamentals Of Acoustics, (which is very well written, highly recommended, and Figure 3.6 pertains to this discussion.) Just because room acoustics are analytically intractable does not mean that the acoustics for a specific room can not be measured-they can, and it can be done with a standard PC computer, a set of inexpensive computer speakers, and an inexpensive microphone from a computer head set. As an example, I will do so for my office/computer room, below-the speakers are Altec Lansing VS-2120s, the microphone is on my computer headset, a Plantronics .Audio 90s, the OS system is Linux, and the analytical software is the truly outstanding Baudline FFT time-frequency browser designed for scientific visualization of the spectral domain. Only one Altc Lansing will be used, and it is the middle of the short wall, mounted about 9" off the wall, (about 3' off the floor,) pointing into the middle of the room. The Linux/Altec Lansing sound system is calibrated for +85 dB SPL, (maximum-OSHA 1910.95 compliant,) as per Linux Sound System Calibration. The room is 11.7' X 11.2' X 7.9', with no sound dampening and hardwood floors, (a nearly square room, with live floors/walls/ceiling-it doesn't get much worse than that, acoustically.) A fairly typical home office/computer room. Sound pressure level, (SPL,) decreases by half every time the distance from a speaker is doubled. Suppose the SPL is measured at a distance of 1 meter from a speaker, and then two meters. The SPL should be half as much. At 6 meters, its half as much again, and at 12 meters, half as much again, and so on-it is one of the fundamental properties of sound. We can use this property for the measurement of room acoustics by taking measurements at different distances from the speaker. Note that if a measurement is taken directly at the speaker, it will have a very high intensity-far greater than any reflected wave, (since the reflected waves had to travel to a wall, and back, decreasing by a factor of 2 with doubling distance, during the trip.) So, as the distance is increased from the speaker, (initially, the sound intensity is dominated by the sound from the speaker, so much so it dominates the reflected sound,) the reflected sound adding to, or subtracting from, the sound from the speaker, creating nodes and nulls, (peaks and valleys,) in the sound level at different distances, (and different frequencies.) It is a viable measuring technique. The various frequencies, (at various distances from the speaker,) could be measured, but this can be automated, (this is where the Baudline program comes in.) Instead of using different frequencies, white noise will be used as the signal, (it will be generated though the PC's sound card by Baudline's output, to drive the computer speaker,) and white noise contains all frequencies, simultaneously-so only one measurement, for each distance, has to be taken. The output of the computer microphone will be connected to Baudline's input, which will determine the sound pressure detected by the microphone, at each and every frequency-and make a datafile for each distance, which can be graphed. The distances, from the speaker, will be 3", 6", 12", 24", and, 48". The only caveat is that the speaker must be able to generate a sufficient signal, to keep output of the microphone out of the noise, (the noise floor will be measured at the 3" and 48" distance, to verify that the signal amplitude was adequate-the low frequency roll off of the Altec Lansing VS-2120 speakers is 70 Hz., and the Plantronics .Audio 90 microphone is 50 Hz., providing unreliable data below these frequencies.) The noise floor:
Figure I. Noise Floor Frequency ResponseFigure I is a plot of the noise floor, (i.e., the speaker was producing nothing,) with the microphone 3" from the speaker, (called the near field,) and 48" from the speaker, (called the far field.) The sound pressure levels, (i.e., the Y axis,) is relative sound pressure, and has no relevance to anything absolute, (like SPL from a sound meter.) The bump at about 175 Hz. is the amplifier electronics noise at 3" from the speaker. The spikes are from the computer fans, etc. The wide spike at about 20 Hz. is from my keyboard, operating the Baudline program to take the data. (EEs should note the 1/f^n LF break of about 80 Hz., the sound card is a SoundBlaster/Ensoniq CT4810.) Of importance is the noise floor, about -110 dB SPL, relative, (the relative scale is the same in this, and the next figure.) The frequency response:
Figure II. Frequency Response at Various DistancesFigure II is a plot of the acoustical frequency response of the room, at various distances, 3", 6", 12", 24", and, 48", from the speaker. The speaker was generating 85 dB SPL, (and the measurements from the microphone are relative SPL, i.e., the reference for 0 dB on the Y axis can not be determined, but the relationship between the graphs can.) As anticipated, the low frequency roll off of the speaker and microphone did not produce adequate signal in the 100 Hz. range. Note that the speaker has about a +/- 7 dB amplitude frequency response from about 60 to 300 Hz., (Baudline was programmed to analyze frequencies below 344 Hz. for this test.) The shape of the top, (red,) graph is typical for a small footprint speaker, where the speaker driver/enclosure is optimized for a small enclosure-the speaker enclosure is a ported/vented design, with a low frequency response of about 175 Hz., and then the output is enhanced with electronic frequency contouring to achieve a low frequency response of about 70 Hz. Note that the top, (red,) line in Figure II, (which was taken with the microphone at 3" from the speaker, i.e., the near field,) has no sharp bumps. However, as the distance is increased to 4' from the speaker, the standing waves, (i.e., frequency distortion,) is quite apparent. (Observe the progression from the top, red, line to the bottom, light blue, line.) Note also the peaks and troughs in the bottom, light blue, line are a difference of 10-20 dB, an order of magnitude! The slight shift to the left as the distance in increased is due to the relation of the microphone to the room walls-the standing waves, at each frequency, are stationary, relative to the microphone. At 50 Hz., (the fundamental room mode = 565 / length,) there is a very deep trough in the sound level near the center of the room-and an increase near the walls. Note, also, that the peaks and troughs form a comb filter, i.e., a peak, followed by a trough, followed by a peak, and so on across the frequency spectrum, (this is a consequence of trigonometry-the addition of sine waves, at different delays, and the physics of sound waves-and there is not much that can be done about it; any speaker in this room would have similar characteristics, although dipole speakers do, indeed, offer better performance.) The problem can't be solved, (except by listening outdoors where there aren't any walls,) but the problem can be moved around, with the addition of speakers, etc., to make a sweet spot listening position-but that is at the expense of making things worse somewhere else in the room, (remember about the addition of sine waves at different delays-it only aggravates the problem, somewhere.) Special rooms of special dimensions, with no parallel walls or ceilings can certainly help, (that's the way movie theaters do it,) and sound damping can help in the mid range of a few hundred Hertz, (but is ineffective at lower frequencies.) Acoustic foam on walls can help, (that's the way recording studios do it,) too. Also, when monitoring via speaker in a recording studio, the speakers are often arranged in a near field configuration, (i.e., similar to the test procedure, above; the speakers-generally acoustic suspension- are located very close to the head of the listener, usually within a couple of feet, and recalibrated for 85 dB SPL by the calibration engineers at the listener's head, to swamp out standing wave phenomena-making a local monitoring sweet spot.) But none of these solutions are practical for a typical home. This is why musicians and sound/recording/mixing engineers often prefer headphones over speakers, (and there is low frequency sound on CDs below 5 Hz.) LicenseA license is hereby granted to reproduce this design for personal, non-commercial use. THIS DESIGN IS PROVIDED "AS IS". THE AUTHOR PROVIDES NO WARRANTIES WHATSOEVER, EXPRESSED OR IMPLIED, INCLUDING WARRANTIES OF MERCHANTABILITY, TITLE, OR FITNESS FOR ANY PARTICULAR PURPOSE. THE AUTHOR DOES NOT WARRANT THAT USE OF THIS DESIGN DOES NOT INFRINGE THE INTELLECTUAL PROPERTY RIGHTS OF ANY THIRD PARTY IN ANY COUNTRY. So there. Copyright © 1992-2008, John Conover, All Rights Reserved. Comments and/or problem reports should be addressed to:
|
Home | John | Connie | Publications | Software | Correspondence | NtropiX | NdustriX | NformatiX | NdeX | Thanks