|
From: John Conover <john@email.johncon.com>
Subject: Median Value of DJIA as a Function of Data Set Size
Date: 9 Jun 2003 21:51:34 -0000
Calculating the median value of the DJIA is difficult. Here's why.
The historical time series of the DJIA was obtained from Yahoo!'s database of equity Historical Prices, (ticker symbol
^DJI,) for the time interval January 2, 1900, through June 6,
2003-and converted to a Unix database format using the
csv2tsinvest
program. The converted filename were
djia1900-2003.
The median value of the DJIA on June 6, 2003 was calculate using the 28,261 day time series of the DJIA and the following Unix script:
    #!/bin/sh

    DAYS="28261"

    while [ "${DAYS}" -ge "1" ]
    do
        echo -e "${DAYS}        \c"
        tail -${DAYS} djia1900-2003 | tsmath -l | tslsq -o | tsmath -e | tail -1
        DAYS=`expr "${DAYS}" - 1`
    done > median.value
and plotted:
|
|
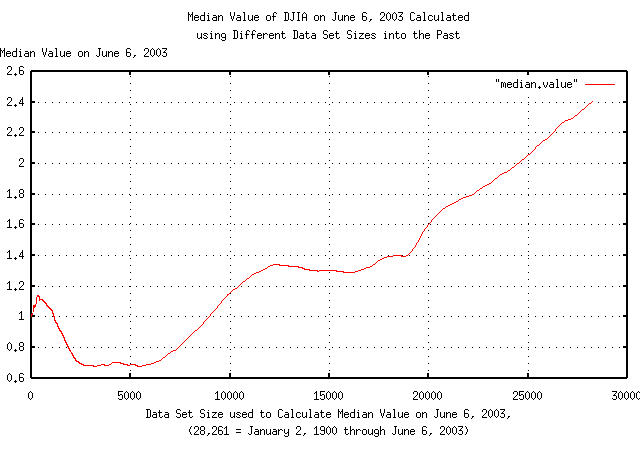
Figure I is a plot of the calculated median value of the DJIA on June 6, 2003, based on data set size. For example, using the last 15,000 days for the calculation, the median value of the DJIA would be about 1.3-meaning that the DJIA would be considered over valued by about 30% on June 6, 2003. Likewise, if 5,000 days were used, the DJIA would be under valued by about 30%.
Why the 30% discrepancy? Its because of the bubbles-there were two in the last century that were significant:
The Great Depression of 1929:
The Roaring 90's:
During the Great Depression of 1929, the DJIA lost about 90%-decreasing about an order of magnitude-of its value-at its lowest-and the bubble lasted about a quarter of a century; about a four standard deviation event, (for particulars, see the DJIA Example section in Quantitative Analysis of Non-Linear High Entropy Economic Systems III.)
The Roaring 90's bubble lasted about sixteen years, and the DJIA increased by a factor of ten-an order of magnitude-only to lose about 40% of its value in two and a half years; about a 3.5 standard deviation event followed by a three standard deviation event.
Note that:
    tsfraction djia1900-2003 | tsavg -p
    0.000234
    tsfraction djia1900-2003 | tsrms -p
    0.011039
    tsshannoneffective.html 0.000234 0.011039 28261
    For P = (avg / rms + 1) / 2:
        P = 0.510599
        Pcomp = 0.499767
says that even with 28,261 daily closes for the DJIA time series, our knowledge of the DJIA's median value on June 6, 2003 is quite marginal-the data set size is too small, and there were several unusual rare events in the time interval represented by the data. However, it does appear that the median value of the DJIA is somewhere between its nominal value and 30% over valued.
--

John Conover, john@email.johncon.com, http://www.johncon.com/