|
From: John Conover <john@email.johncon.com>
Subject: Analyzing the Spread of the SoBig.E Virus
Date: 25 Jun 2003 18:42:16 -0000
As you will recall, I analyzed the spread of SARS in Analyzing the Spread of SARS with the Logistic Function on April 24, 2003, which:
"... shows [the] infection rate slowing in about two months, with about 9,000 infections, world wide"
in the second paragraph under Figure I.
|
As a side bar, although the analysis of the spread of SARS seems impressive, it must be remembered that the logistic, (what Europeans call the discreet time parabolic,) function has other solutions, too-exhibiting long term cyclic phenomena which tends to phase-lock on the particular idiosyncrasies of the specific virus. There is a very significant probability that the SARS outbreak in the Autumn of 2003 will be a repeat of late 2002/early 2003 outbreak; and not only that, it will probably be worse. Such is the nature of the logistic/parabolic function. |
Computer virii are called that because of the way they spread-they follow the logistic/parabolic function, too, (its a predator-prey model.)
Like many, my e-mail servers got hit today with the so-called
SoBig.E virus. I made a file of the cumulative hits, per
hour, in a file, cnt, and
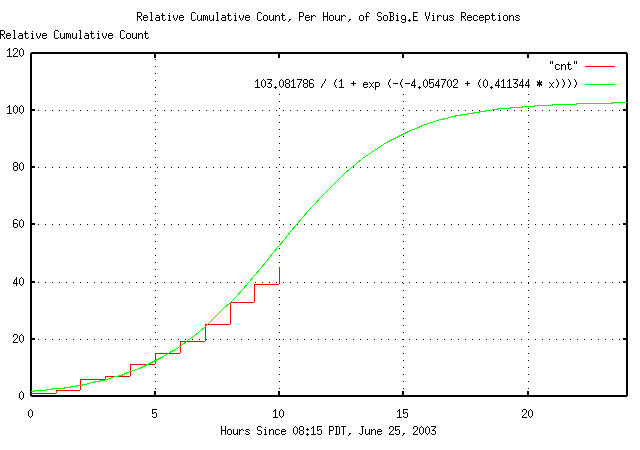
least-squares-fit a logistic function to the data:
    tslsq -l -p cnt
    103.081786 / (1 + e^(-(-4.054702 + 0.411344t)))
|
|
Figure I is a plot of the relative cumulative count, per hour, of the SoBig.E virus receptions, starting at 08:15 PDT, June 25, 2003, and shows the infection rate increasing, then leveling off late tomorrow.
--

John Conover, john@email.johncon.com, http://www.johncon.com/