|
From: John Conover <john@email.johncon.com>
Subject: Analyzing the Spread of SARS with the Logistic Function
Date: 22 Apr 2003 08:39:21 -0000
Note: there is an addendem concerning this page on Analyzing the Spread of the SoBig.E Virus. From the sidebar:
"... although the analysis of the spread of SARS seems impressive, it must be remembered that the logistic, (what Europeans call the discreet time parabolic,) function has other solutions, too-exhibiting long term cyclic phenomena which tends to phase-lock on the particular idiosyncrasies of the specific virus.
There is a very significant probability that the SARS outbreak in the Autumn of 2003 will be a repeat of late 2002/early 2003 outbreak; and not only that, it will probably be worse.
Such is the nature of the logistic/parabolic function."
This analysis originally appeared in the NdustriX and NtropiX mailing lists.
Note: there are some interesting recent URLs concerning SARS. The Genome Sciences Cenre decoded the SARS DNA sequence on April 12, 2003. See their SARS-associated Coronavirus page for particulars. The Linux Journal has a web page on the technical aspects of Sequencing the SARS virus. The sequence itself is available at http://mkweb.bcgsc.ca/sars/AY274119.fa, as a text file in FASTA format, consisting of a header line and the sequence, split into fixed length lines.
The sequence was identified as a fourth group of coronaviruses on April 12, 2003, (its closest cousin is bovine coronavirus.)
On April 22, 2003, the SARS data was downloaded from the World Health Organization's Cumulative Number of
Reported Probable Cases of Severe Acute Respiratory Syndrome
(SARS) and edited in a text editor, (specifically, adding a data
point for Sundays, where there was no data-half way between the
Saturday and Monday values were used,) to make a time series, sars,
of the cumulative number of SARS cases from March 17, 2003, to April
22, 2003. (Note that differential diagnosis for SARS is not consistent
over the world, for example, see CDC Media Relations -
SARS US Case Report for the number of US cases from the Centers for Disease Control and
Prevention which is inconsistent with the WHO data.)
The logistic function, or S-Curve, was suggested by William S. Jevons, (as cited by Alfred Kleinknecht,) in 1884-but there were earlier works, too. R. Ayres extended the concept, and so did the Russian economist N. D. Kondratieff in 1926. Schumpeter made contributions, also. The logistic function is often used in the analysis of disease epidemics[1], but is difficult to use because of numerical stability issues which are characteristic of all non-linear dynamical systems, (NLDS.) Very small errors in data can create very large errors in the analysis-in point of fact, the analytical errors diverge exponentially, (see the Ljapunov Exponent for particulars.)
The source code to the software used in the analysis is available from the Utilities page on the NdustriX site, and is distributed under License.
tslsq -l -p sars
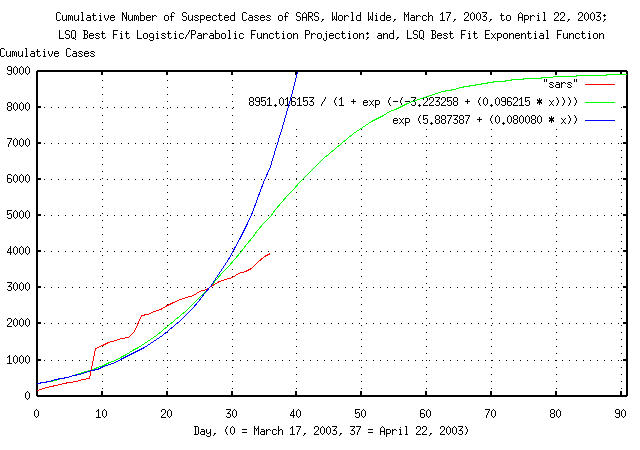
8951.016153 / (1 + e^(-(-3.223258 + 0.096215t)))
tslsq -e -p sars
e^(5.887387 + 0.080080t)
|
|
Figure I is a plot of the cumulative number of reported probable cases of Severe Acute Respiratory Syndrome, from March 17, 2003, to, April 22, 2003, and the logistic function least-squares-best-fit to the data. For comparison, the exponential least-squares-best-fit to the data is, also, included. Of interest is the close proximity of the logistic and exponential functions at the beginning of the analysis, (and, since all three are in close proximity, it means we really don't have enough data; its not an issue of having enough data-its an issue of having data over enough time.)
The least-squares-best-fit curve fitting methodology is the most accurate possible, and shows the projection of infection rate slowing in about two months, with about 9,000 infections, world wide.
But how accurate is the best possible accuracy?
It turns out that its not an easy question to answer, but we can get some feel for it.
tsderivative sars > sars.derivative
tslsq -p sars.derivative
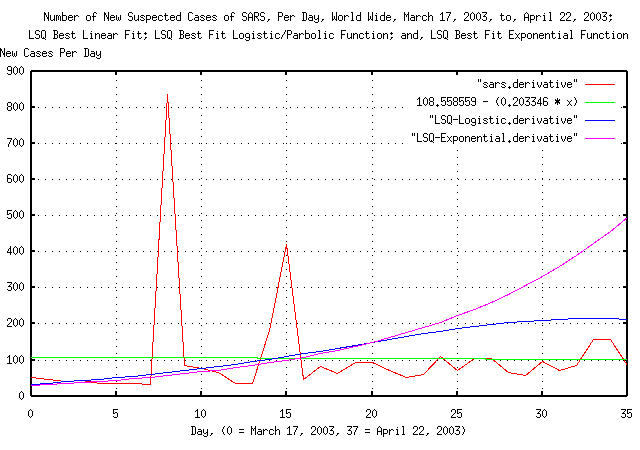
108.558559 + -0.203346t
tslsq -l sars | tsderivative > LSQ-Logistic.derivative
tslsq -e sars | tsderivative > LSQ-Exponential.derivative
|
Figure II is a plot of the derivative of the cumulative number of reported probable cases of Severe Acute Respiratory Syndrome, from March 17, 2003, to, April 22, 2003, the derivative of logistic function least-squares-best-fit to the data, and, the derivative of the exponential least-squares-best-fit to the data. The linear least-squares-best-fit of derivative of the the data is included for comparison. The figure plots the number of new cases of SARS per day. Of interest is the divergence between the exponential and logistic functions. The logistic fit appears to provide the best fit, being relatively accurate on day 3, with about a 25% error in the number of new cases reported on day 33, (actually, predicting high.)
If the mechanism of the spread of SARS has exponential characteristics, then the deterministic mechanism would be a geometric progression:
    tsfraction sars > sars.fraction

    tslsq -l sars | tsfraction > LSQ-Logistic.fraction

    tslsq -e sars | tsfraction > LSQ-Exponential.fraction
|
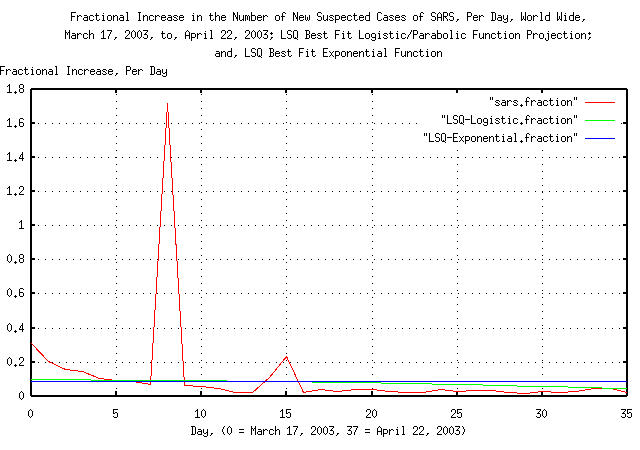
Figure III is a plot of the fractional increase in the cumulative number of reported probable cases of Severe Acute Respiratory Syndrome, from March 17, 2003, to, April 22, 2003, the fractional increase of logistic function least-squares-best-fit to the data, and, the fractional increase of the exponential least-squares-best-fit to the data. Of interest is the difference between the logistic fit and exponential fit-if, and only if, the spread of SARS is a geometric progression, the plot would be a straight line. The logistic fit is relatively accurate on day 5 and 33.
The spread of SARS does seem to be a deterministic progression that is not exponential:
    tsdeterministic sars > sars.deterministic

    tslsq -l sars | tsdeterministic > LSQ-Logistic.deterministic

    tslsq -e sars | tsdeterministic > LSQ-Exponential.deterministic
|
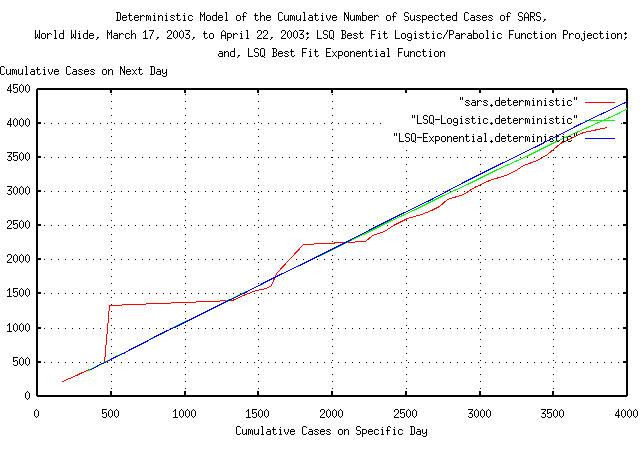
Figure IV is a plot the deterministic mechanism of the cumulative number of reported probable cases of Severe Acute Respiratory Syndrome, from March 17, 2003, to, April 22, 2003, the deterministic mechanism of logistic function least-squares-best-fit to the data, and, the deterministic mechanism of the exponential least-squares-best-fit to the data. The figure plots how the spread of SARS proceeds, one day to the next. The spread of SARS does seem to be deterministic.
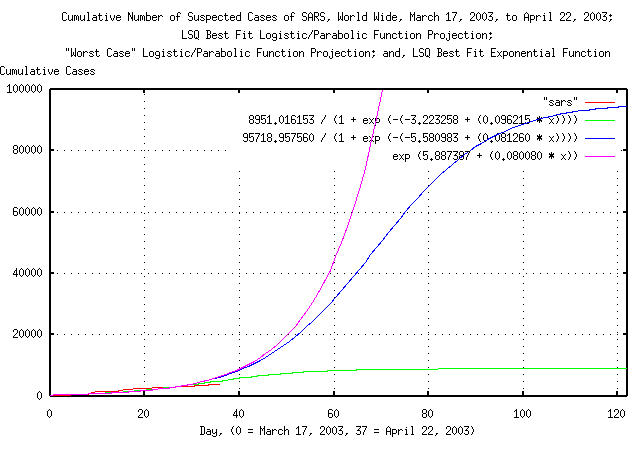
    tslsq -l -p sars
    8951.016153 / (1 + e^(-(-3.223258 + 0.096215t)))

    tslsq -c 99000 -f 12 -l -p sars
    95718.957560 / (1 + e^(-(-5.580983 + 0.081260t)))

    tslsq -e -p sars
    e^(5.887387 + 0.080080t)
|
Figure V is a plot of the cumulative number of reported probable
cases of Severe Acute Respiratory Syndrome, from March 17, 2003, to,
April 22, 2003, the logistic function least-squares-best-fit to the
data, and the logistic function least-squares-best-fit to the data
with its algorithmic convergence modified. The algorithmic
convergence was altered to force the tslsq
program's best fit mechanism to accommodate slight data errors,
producing a maximal least-squares-best-fit to the data; it is
the maximal logistic function solution that can be supported by the
data, (its actually the solution just before the convergence algorithm
goes unstable, and has to found by iteration.) For comparison, the
exponential least-squares-best-fit to the data is, again, included. Of
interest is the discrepancy between the the logistic
least-squares-best-fit and the logistic maximal
least-squares-best-fit; a discrepancy of an order of magnitude in the
final cumulative number of SARS cases, world wide.
What the analysis says is that we do not have data over a long enough time to make any reliable assessments about the spread of SARS, world wide. However, assuming the data is accurate, (and that's questionable at this time, too,) the best estimate is that the cumulative number of SARS cases, world wide, will begin to slow in about two months, with about 10,000 cumulative cases. However, this estimate may be low by an order of magnitude, (or even more, if the data used in the analysis is unreliable or inaccurate.)
[1] Predictions, Theodore Modis, Simon & Schuster, New York, New York, 1992, ISBN 0-671-75917-5, pp. 97-105.
--

John Conover, john@email.johncon.com, http://www.johncon.com/