From: John Conover <john@email.johncon.com>
Subject: What does the phrase "likelihood of an up movement" for a stock mean?
Date: 28 Aug 1999 05:59:16 -0000
Someone ask the relationship between the Shannon Probability and the
likelihood of an up movement in the value of a stock. The Shannon
Probability, P, is calculated by finding the average, avg, and the
root mean square, rms, of the marginal increments in the value of a
stock:
avg
--- + 1
rms
P = -------
2
where the t'th marginal increment at time t is:
V - V
t t - 1
-----------
V
t - 1
ie., today's marginal increment in the value of a stock is today's
value, minus yesterday's, divided by yesterday's.
Exactly why the ratio of the average and root mean square of the
marginal increments, over time, give the likelihood of an up movement
in the value of a stock is not a trivial question to answer-and there
is a discussion of such things on the Ntropix FAQ's web page at:
http://www.johncon.com/ntropix/FAQs.html
which are fragments and excerpts from the tsinvest program sources and
documentation, available at:
http://www.johncon.com/ntropix/
However, it is very easy to verify-just count the number of up
movements in a stock's value in a time period, and compare it to the
Shannon probability, P, measured and calculated over the same time
period.
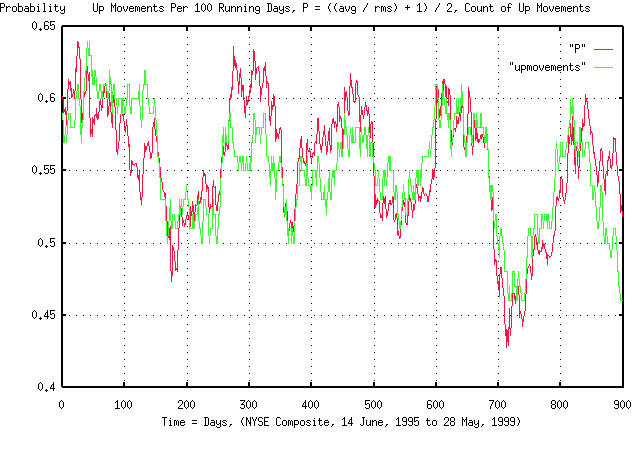
The attached is a graph of the comparison over the last one thousand
days of the NYSE Composite Index.
John
BTW, the way the graph was made using the tsshannonwindow program,
(from http://www.johncon.com/ntropix/utilities.html,) with -a
-e -w 100 arguments for a running window of 100 days. Note that there
are issues with just counting the up movements. How are days where
there is no movement in value handled, (ie., count it as an up
movement, or a down movement, neither, or both?) And, there is no
tally of how large an up movement is, just that it moved
up. Nevertheless, the graph shows that the Shannon probability and the
likelihood of an up movement are the same, and counting up movements
over an interval is a intuitive heuristic approach to quantifying
stock value performance.
--

John Conover, john@email.johncon.com, http://www.johncon.com/