| john@email.johncon.com |
| http://www.johncon.com/john/ |
|
|
|
||
US Historical Energy Consumption |
|||
Home | John | Connie | Publications | Software | Correspondence | NtropiX | NdustriX | NformatiX | NdeX | Thanks
|
The US energy consumption will be analyzed using data from 1635 to 2000. The US is an industrialized country, which means the GDP depends on an abundance of energy. The data is typical of other industrialized countries.
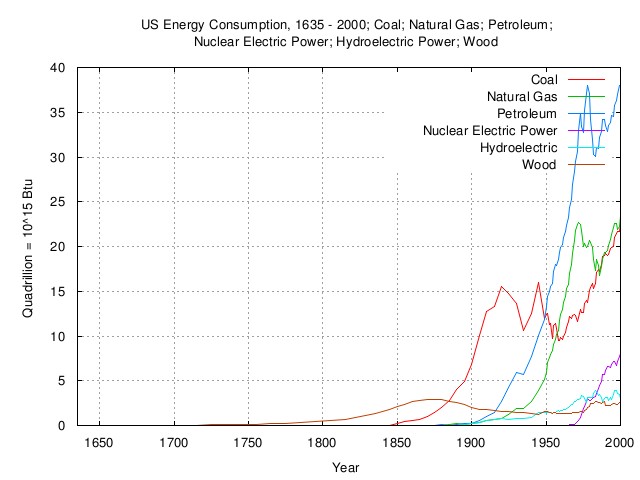
Figure I is a plot of the US energy consumption, 1635 through 2000, in BTU from the various energy resources.
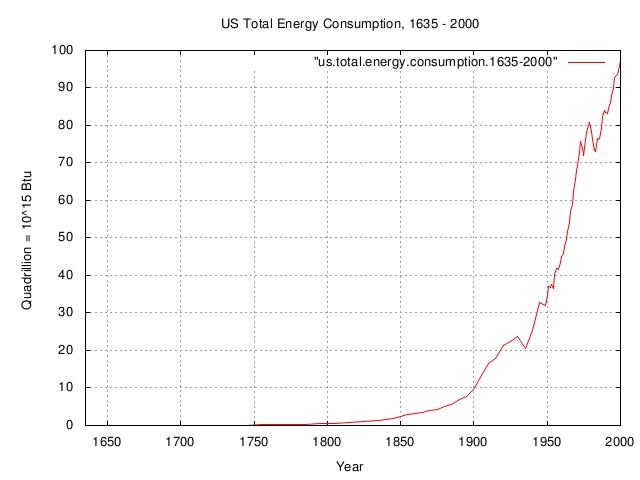
Figure II is a plot of the total US energy consumption, 1635 through 2000, in BTU from the various energy resources, obtained by adding the the usage of all energy resources together, from the previous graph, Figure I.
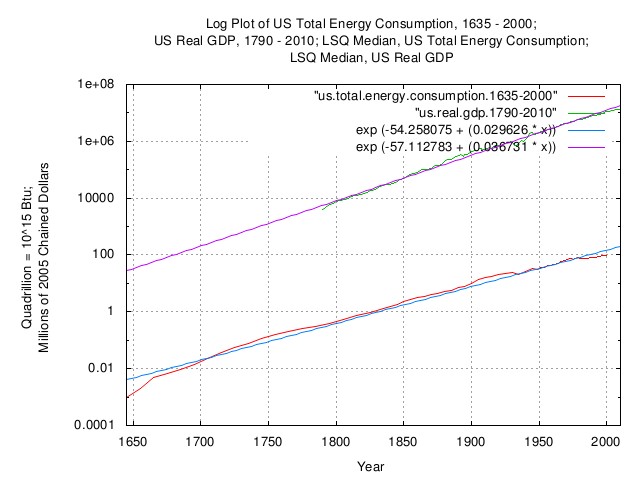
Figure III is a log plot of the total US energy consumption, 1635 through 2000, in BTU from the previous figure, Figure II, and, a Log plot of the US real GDP, chained 2005 dollars. Included is the LSQ median, for both. (Note that median, in this case, means half of the time the empirical data is above the LSQ median, and half of the time, below.) Note the slope of the LSQs, indicating the that US has become more efficient at generating a unit of real GDP per unit of energy, (further, it is a log plot, so the US has become exponentially more efficient, over time-about 0.007% per year, compounded.)
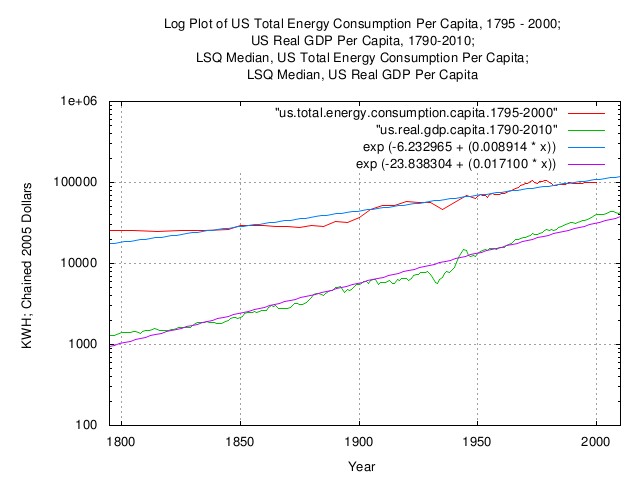
Figure IV is an expanded log plot of the total US energy consumption per capita, 1795 through 2000, (i.e., adjusted for population size,) in KWH for convenience, from the previous figure, Figure V, (divided by the population size,) and, a Log plot of the US real GDP per capita, chained 2005 dollars. Included is the LSQ median, for both. (Note that median, in this case, means half of the time the empirical data is above the LSQ median, and half of the time, below.) Note the slope of the LSQs, indicating the that US population has become more efficient at generating a unit of real GDP per unit of energy, (further, it is a log plot, so the US population has become exponentially more efficient, over time-about 0.008% per year, compounded, since 1795; more so since the 1960's.) As of 2000, it took 100,000 KWH to generate US $40,000 in mean real GDP. Photoelectric EnergyThe photoelectric effect was first discovered in 1839 by Alexandre Edmond Becquerel. In 1905, Albert Einstein formalized the foundations of the effect, (for which, he was to win a 1922 Nobel Prize,) and in 1916, Robert Millikan provided experimental proof of Einstein's theory. Unfortunately, photoelectric energy, the conversion of sun light into electricity, is a low efficiency process-about 7% according to Einstein's formalization, which can be increased to about 20% before it becomes cost prohibitive. At issue is amaturizing the initial cost of the solar cells over their life expectancy; does the electricity it produces cost less than the electricity produced by power generating plants? (Refer to Figure IV for the effects of raising energy costs on the US GDP.) About 1 KWH is produced by one square meter of direct
sunlight / hour, (1 KWH = 3,400 BTU's,) at solar noon, at the
equator, (multiply this by 0.7 for 40 degrees north.) At 20%
efficiency a one square meter solar cell will produce
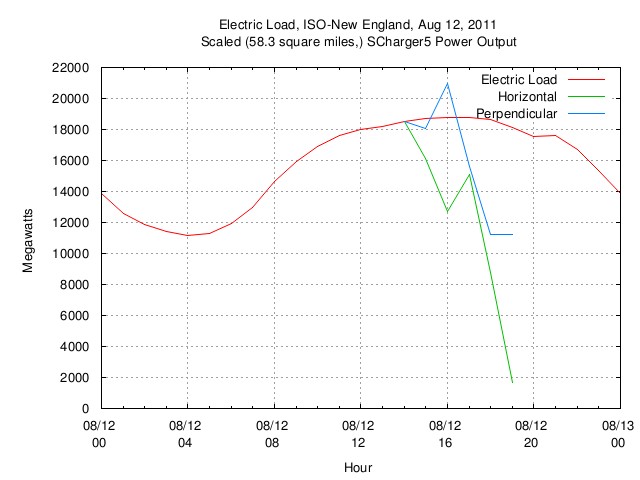
There is another issue with photoelectric electricity, and that is its peak power in the day occurs at solar noon. But peak energy usage, (in summer,) is much later in the day in the US. This does not mean that solar energy is not beneficial. Solar thermal, (a different way of converting sunlight into usable energy,) can run well over 70% efficient, (not to mention ocean/tide and wind power alternatives, which demonstrate high efficiencies, also.) As an example of a large scale photoelectric generating
station, 58 square miles in area, supplying all the energy
used in the ISO New England distribution system at solar noon
on August 12, 2011, (hottest day of 2011):
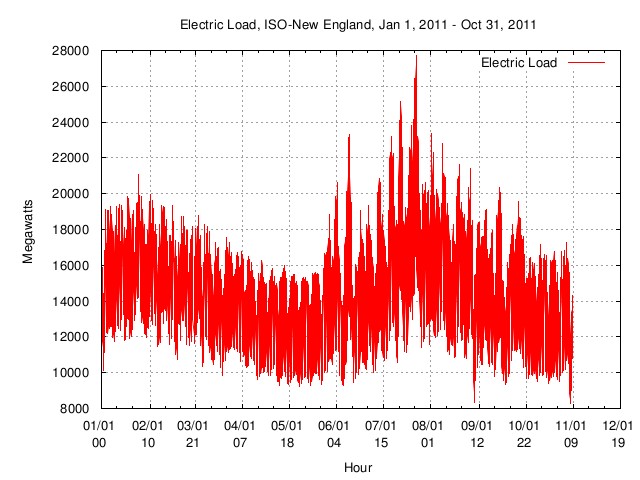
Figure V is a plot of the electric load on the ISO New England distribution system, from January 1, 2011, through, October 31, 2011.
Figure VI is a plot of the electric load on the ISO New England distribution system, August 12, 2011, midnight, through, midnight. Super imposed is the power output of a solar cell, 20% efficient, (yes, the author does use solar cells, the actual measurement was made in California, 41 degrees north,) scaled to 58 square miles to provide the equivalent energy distributed by ISO New England at the time of peak demand, 16:00. Note the short time of the electricity production of the solar cell, compared to the broadness of the demand. The point is-and energy independence is an important point-that intelligent decisions have to be made that do not effect the standard of living in the US, meaning increasing the GDP per capita, and the energy to produce it. (Again, refer to Figure IV for the effects of raising energy costs on the US GDP.) ArchiveThe data presented here can be reconstructed, in its entirety, from the historical.economics.tar.gz tape archive file, which contains all data and references, thereto. The source code to all programs used in the analysis is available from the NtropiX site, tsinvest.tar.gz, and, the NdustrixX site, fractal.tar.gz, tape archive files. All use the "standard" Unix development systems of rcs(1) and make(1) to facilitate replication. It should be noted that many of the data set sizes are pitifully small-some as few as two hundred data points, (a standard error of about 7% of the standard deviation,) and conclusions can only be regarded as circumstantial. LicenseThe information contained herein is private and confidential and dissemination is strictly forbidden, except under the provisions of contractual license. THE AUTHOR PROVIDES NO WARRANTIES WHATSOEVER, EXPRESSED OR IMPLIED, INCLUDING WARRANTIES OF MERCHANTABILITY, TITLE, OR FITNESS FOR ANY PARTICULAR PURPOSE. THE AUTHOR DOES NOT WARRANT THAT USE OF THIS INFORMATION DOES NOT INFRINGE THE INTELLECTUAL PROPERTY RIGHTS OF ANY THIRD PARTY IN ANY COUNTRY. So there. Copyright © 1992-2016, John Conover, All Rights Reserved. Comments, questions, and problem reports should be addressed to:
|
Home | John | Connie | Publications | Software | Correspondence | NtropiX | NdustriX | NformatiX | NdeX | Thanks