| john@email.johncon.com |
| http://www.johncon.com/john/ |
|
|
|
||
Using Python's Complex Variables to Design Speakers |
|||
Home | John | Connie | Publications | Software | Correspondence | NtropiX | NdustriX | NformatiX | NdeX | Thanks
|
Most design methodologies for vented speaker enclosures follow D. B Keele[1], which was based on the works of A. N. Thiele and Richard H. Small [3] [4]. The methodology uses complex variables, (i.e., s = ρ + iω,) representing small signal, lumped sums, of the parameters that define a speaker's performance. Virtually all speaker driver manufacturers distribute the so called TS, (Thiele Small,) parameters for development of their products into custom designed enclosures. Since the Python programming language supports complex variables, speaker enclosures can be designed, quite expediently, with a computer such as a Raspberry Pi, (in point of fact, the design outlined here was done on a Raspberry Pi 3B+, then tested on Debian Linux 10 "Buster", with no modifications.) Execution times for the RPi, to do all 5 simulations is under one second. All design files are available in the tape archive, Splane.tar.gz, (about 50 KB,) to replicate the entire design procedure used. (There are updated design files available: Splane2.tar.gz.) Choosing the Evaluation Design:To verify the design methodology, and software implementation, (i.e., Python scripts,) a corner solution is chosen, (i.e., a required solution that is at the edge, or slightly beyond, the range of applicability of the methodology.) An enclosure for a 3 1/2" inch Dayton Audio ND90-4 driver is to be designed using subwoofer design parameters, and, the simulations should accurately indicate the poor design choice, i.e., a "boom box," while at the limit of the methodology's applicability. The limits are:
The traditional method of developing a speaker enclosure that has been used since the 1960's is to build a prototype enclosure, based on guessing several parameters, and then make measurements and adjust the prototype design to achieve an acceptable solution. The method outlined here is much the same, except the prototype enclosure is simulated, evaluated, and modified, using software in an iterative process as suggested by Keele[2], prior to building the prototype providing greater accuracy for an optimized solution. Quick Start:
A Spice simulation is also available in the tape archive, (using ngspice(1), with schematic entry using gschem(1), all available from the Debian and Raspberry repositories):
Simulation Results:
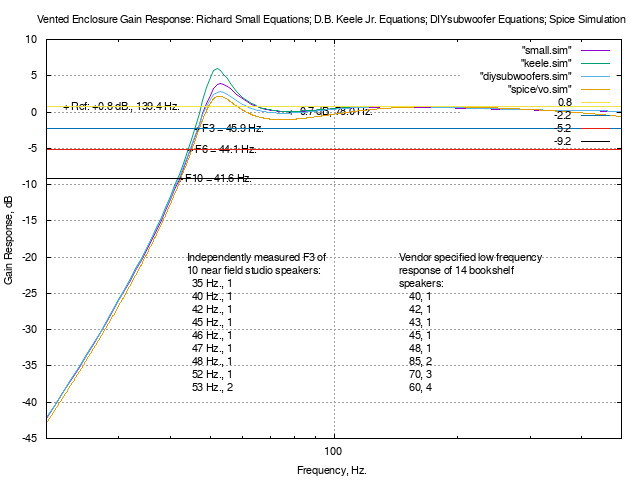
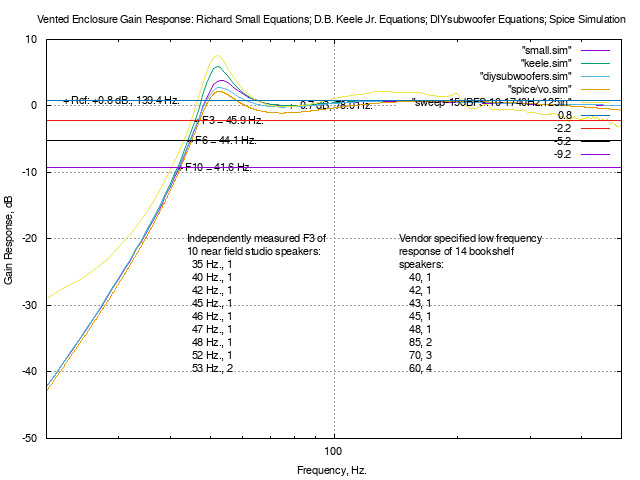
Figure I. Simulated Frequency Response of SpeakerFigure I is a plot of the simulated frequency response of the prototype enclosure for the ND90-4 driver, as optimized by The Subwoofer DIY Page. The plot is the simulations from Small[3] [4], Keele[1] [2], The Subwoofer DIY Page, and, spice, using a derivation of Small[3], Fig. 1,2,3. Although the simulations use different small signal models, the maximum difference between the simulations is 3.3 dB = +/- 1.65 dB at 52 Hz. The optimization used to design this enclosure is rather obvious-maximize low frequency sound production, (a "boom box",) and is most apparent in the frequency range from 50 to 100 Hz. The frequency response is unacceptable for modern sound production, (although it was the prevailing choice for juke box designs of the 1950's.) Note the steep roll off at very low frequencies, (below 52 Hz.,) of 24 dB. per octave. It is a myth that vented enclosures produce more bass at low frequencies-the roll off of sealed enclosures is 12 dB. per octave, (although starting at a higher frequency,) and below the vented enclosure tuning frequency, Fb, can produce significantly more sound power, with a smoother low frequency response. This design, however, does extend the low frequency response from 90 Hz. to 55 Hz., in a smaller enclosure.
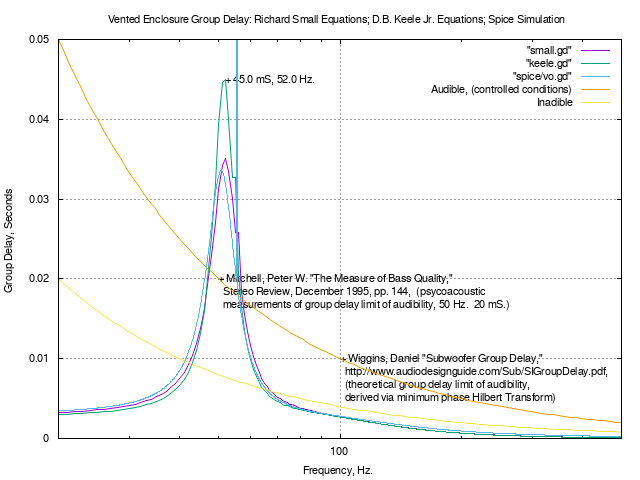
Figure II. Simulated Group Delay of SpeakerFigure II is a plot of the simulated group delay of the prototype enclosure for the ND90-4 driver, as optimized by The Subwoofer DIY Page. The plot is the simulations from Small[3] [4], Keele[1], and, spice, using a derivation of Small[3], Fig. 1,2,3. The plot, also, includes both empirical and theoretical limits of group delay audibility-controlled conditions means extremely precise sound system, i.e., head phones. 35 to 45 mS. group delay at 52 Hz. is unacceptable in modern sound systems.
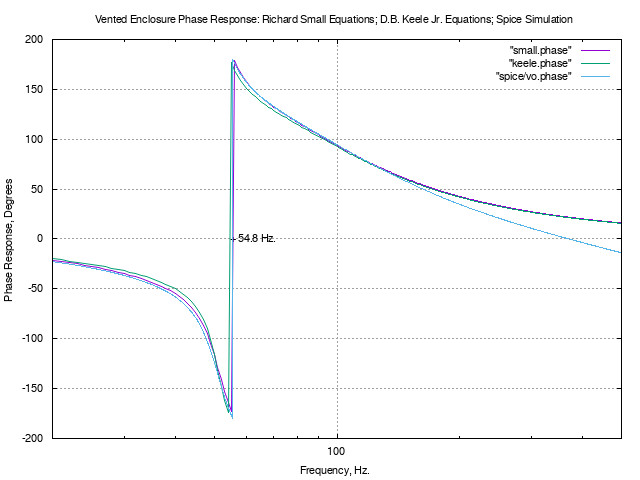
Figure III. Simulated Phase of SpeakerFigure III is a plot of the simulated phase of the prototype enclosure for the ND90-4 driver, as optimized by The Subwoofer DIY Page. The plot is the simulations from Small[3] [4], Keele[1], and, spice, using a derivation of Small[3], Fig. 1,2,3. The phase delay creates the group delay, above, and is 180 degrees out of phase at the vented enclosure tuning frequency, Fb. The measurement of Fb is an important parametric test of a speaker enclosure.
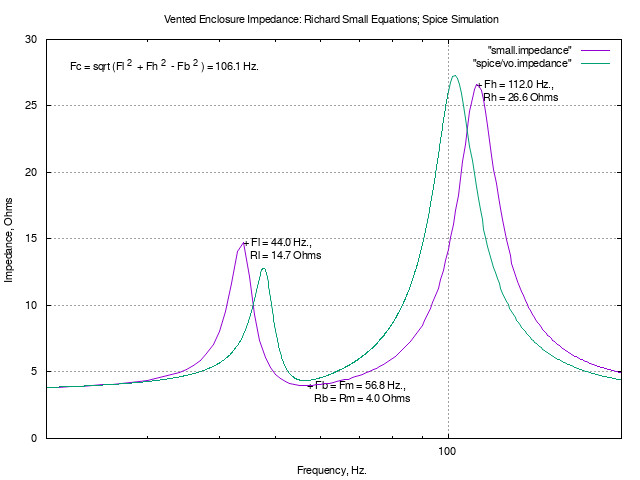
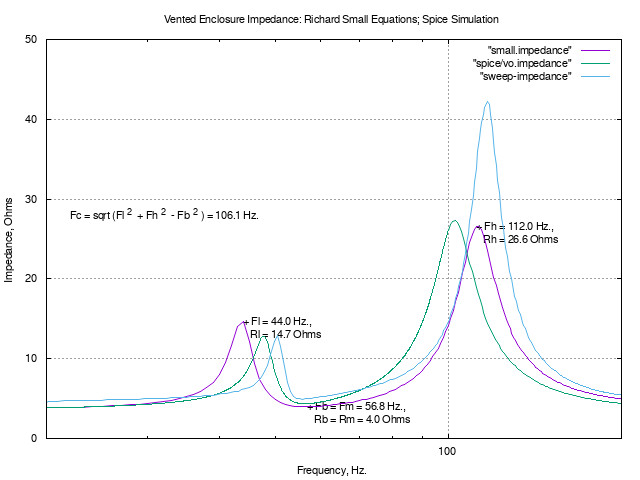
Figure IV. Simulated Impedance of SpeakerFigure IV is a plot of the simulated impedance of the prototype enclosure for the ND90-4 driver, as optimized by The Subwoofer DIY Page. The plot is the simulations from Small[3] [4], and, spice, using a derivation of Small[3], Fig. 1,2,3. The driver impedance is an important parametric test of a speaker enclosure, and is highly dependent on Ql, the Q created by the enclosure losses. The value of Ql is traditionally estimated as 7, the enclosure built, then the impedance measured, and the value of Ql then calculated, and the enclosure rebuilt. The method outlined here simulates the traditional method by calculating Ql from the simulated impedance, (the Python script Ql.py,) from a simple iterated bash(1) script, Ql.iterate.sh. Iteration is required since Ql effects the Qms of the installed driver in the enclosure, which effects Qts, which effects Fb, which effects Ql. The convergence of the iterated solution is fragile, and care must be exercised.
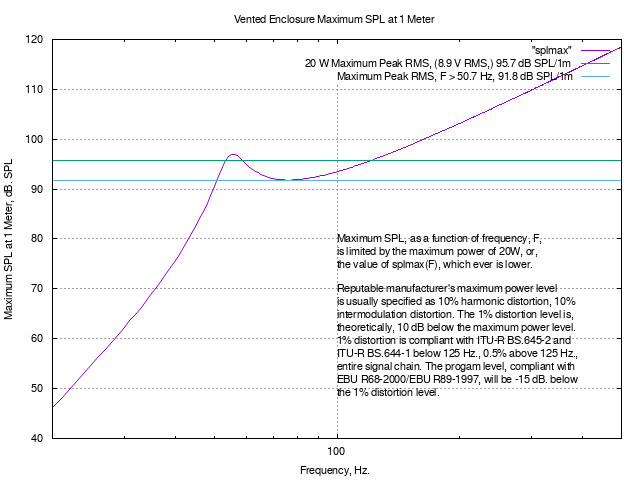
Figure V. Simulated Maximum SPL of SpeakerFigure V is a plot of the simulated maximum SPL of the prototype enclosure for the ND90-4 driver, as optimized by The Subwoofer DIY Page, as a function of frequency. Note that the maximum SPL is limited in the range 50 to 100 Hz., and below 50 Hz. Exceeding these limiting values is the "self destruct mode" of operation for the speaker mounted in this enclosure. This is a characteristic of vented enclosures, (sealed enclosures are limited by the maximum power specification.) A low frequency subsonic filter is often used to limit the signal amplitude at low frequencies to protect the driver.
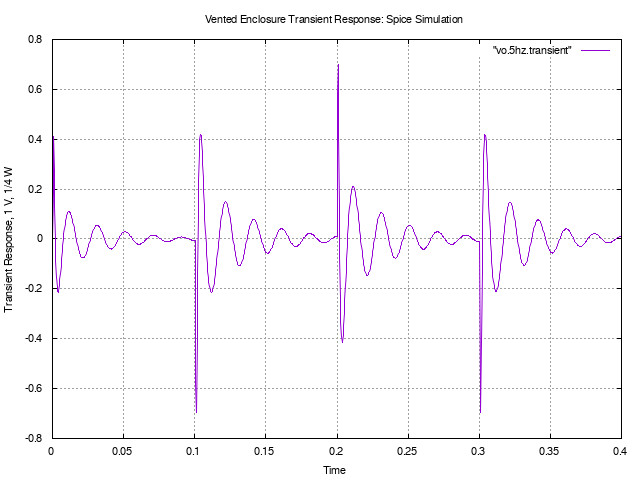
Figure VI. Simulated 5 Hz. Response of SpeakerFigure VI is a plot of the simulated 5 Hz. square wave response of the prototype enclosure for the ND90-4 driver, as optimized by The Subwoofer DIY Page. The plot is the simulation from spice, using a derivation of Small[3], Fig. 1,2,3. Ideally, a 5 Hz. square wave should produce 20 fast "clicks" per second. The "clicks" should appear as short duration spikes in the above wave form. The low frequency ringing, at the enclosure tuning frequency, Fb ~ 56 Hz. ~ A1 on the string bass, means this speaker will color the sound, with no clarity of the bass frequencies, i.e., its called a "one note boom box." Any transient signal will create an A1 note.
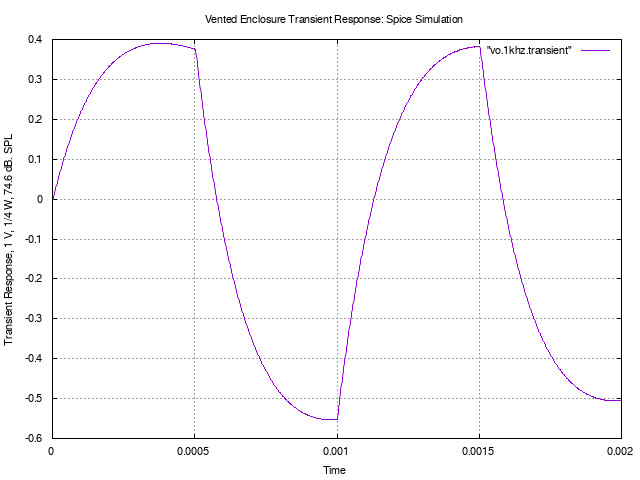
Figure VII. Simulated 1 kHz. Response of SpeakerFigure VI is a plot of the simulated 1 kHz. square wave response of the prototype enclosure for the ND90-4 driver, as optimized by The Subwoofer DIY Page. The plot is the simulation from spice, using a derivation of Small[3], Fig. 1,2,3. Ideally, a 1 kHz. square wave should produce a square wave, with sharp leading edges. The leading edges in the plot is limited by the high frequency capability of the driver. (One of the reasons for this test is to determine the high frequency capability of drivers described as "full range driver.") Emperical Results:The enclosure drawing:
Figure VIII. Simulated and Emperical Frequency Response of SpeakerFigure VIII is a plot Figure I, the simulated frequency response of the prototype enclosure for the ND90-4 driver, as optimized by The Subwoofer DIY Page. The plot is the simulations from Small[3] [4], Keele[1] [2], The Subwoofer DIY Page, spice, using a derivation of Small[3], Fig. 1,2,3, and includes the empirical data for the enclosure, as constructed. The empirical data is from a near field measurement, using two microphones, one for the driver, one for the port, with the microphone element spaced 1/8" from the center of the area being measured. The output of the microphones are complex variables representing the sound intensity of the area being measured, as a function of swept frequency, and summed in a mixer, the output of the port microphone being scaled appropriately via the mixer channel level control, (in relation to the driver level.)
Figure IX. Simulated and Emperical Impedance of SpeakerFigure IX is a plot of Figure IV, the simulated impedance of the prototype enclosure for the ND90-4 driver, as optimized by The Subwoofer DIY Page. The plot is the simulations from Small[3] [4], and, spice, using a derivation of Small[3], Fig. 1,2,3, and includes the empirical data for the enclosure, as constructed. A comparison of the empirical and simulated results appears below. Comparison of Empirical and Simulated Results:To reiterate the objective, this procedure was not to design an appropriate speaker enclosure. An inappropriate driver was intentionally chosen, (a 3 1/2" subwoofer driver is an oxymoron,) and verify that the software and method outlined here would so indicate. Enclosure design values:
Enclosure constructed values, percent error with design values:
Enclosure empirical values:
Enclosure simulated values, percent error with empirical values:
Alternative Solutions:There are a few alternative solutions, with smaller enclosures, included in:
The choice can be made by uncommenting the parameters for the alternative choice, and commenting out any others. The Weems[5] Chebyshev, (9.5, C4, in Table 1,) solution is particularly attractive. This is the default solution simulated:
The Chebyshev solution enclosure is about half the volume of the test speaker, above, and the F6 = +/- 3 dB low frequency cut off is is 45.7 Hz., with 1.5 dB low frequency ripple in the passband; the group delay is 25.7 mS. at 51 Hz., which adequately low for an acoustically non-treated room. This is compared with an F6 = 44.1 Hz., with 7 dB low frequency ripple in the passband; the group delay is 45.0 mS. at 52 Hz. for the "one note boom box." The Chebyshev solution can also produce a Butterworth solution by shortening the port tube, (increasing Fb,) without altering the box. This solution would have an F6 = +/- 3 dB low frequency cutoff of 53.1 Hz., with about 1 dB of passband ripple, (no hole in the low frequency passband); the group delay would be 21.6 mS. at 59.5 Hz. Both of these solutions are nearing commercial studio monitor low frequency characteristics, excepting high frequency characteristics of about:
Which would suffice adequately for an inexpensive, (~ US $25,) utility speaker for a sound bar, TV, computer, etc. with no crossover, phase and time alignment issues, etc. References:
LicenseA license is hereby granted to reproduce this design for personal, non-commercial use. THIS DESIGN IS PROVIDED "AS IS". THE AUTHOR PROVIDES NO WARRANTIES WHATSOEVER, EXPRESSED OR IMPLIED, INCLUDING WARRANTIES OF MERCHANTABILITY, TITLE, OR FITNESS FOR ANY PARTICULAR PURPOSE. THE AUTHOR DOES NOT WARRANT THAT USE OF THIS DESIGN DOES NOT INFRINGE THE INTELLECTUAL PROPERTY RIGHTS OF ANY THIRD PARTY IN ANY COUNTRY. So there. Copyright © 1992-2020, John Conover, All Rights Reserved. Comments and/or problem reports should be addressed to:
|
Home | John | Connie | Publications | Software | Correspondence | NtropiX | NdustriX | NformatiX | NdeX | Thanks