| john@email.johncon.com |
| http://www.johncon.com/john/ |
|
|
|
||
Spice Analysis Of The C-Note Speaker |
|||
Home | John | Connie | Publications | Software | Correspondence | NtropiX | NdustriX | NformatiX | NdeX | Thanks
|
Near field studio monitors and computer gaming audio systems serve similar functions. Usually, studio monitors are slightly larger than gaming systems, but are still small enough to be desk mounted, (or immediately behind the desk, wall or stand mounted.) A near field studio/computer audio system should be capable of producing 85 dB SPL at 1 meter, program level, and a little over 100 dB SPL peak, for compliance with EBU R68-2000, R89-1997, SMPTE RP155/RP200, THX, (except LFE,) and be OSHA 1910.95 compliant for 8 hours per day listening. The frequency response of near field studio monitors is usually about 40 Hz., low frequency F3, (maybe a little higher to about 50 Hz. on some commercial models,) to 20 kHz., -3 dB. The C-Note speakers are a viable example at 11" H x 7.5" W x 9.5" D, with an F3 frequency of 43 Hz., (to 20 kHz., -3 dB,) and a cost of about $100 per stereo system. The C-Note speakers are billed as a bookshelf speakers, and were chosen as an evaluation example. Inexpensive amplifiers, (LM3886, TPA3116/8, TDA7492, PAM8610, TDA2020/4, TDA7492 based units,) are available from the Internet stores for $10 to $30, (stereo,) and are quite adequate for the specifications. The LM3886 based amplifiers require a bipolar power supply, and a Lepai LP-2020TI based on the TPA3118 chip was chosen for its low distortion characteristics, and adequate output power on a single 12 V power supply, (which has the additional advantage of being automotive, solar power, PC +12V rail, etc., compatible.) 12 V and 15 V at greater than 5 A LED string power supplies are available at the internet stores for $8 to $16, depending on reliability specification, and are quite adequate for the power output specification. An S-60-12 12 V, 5 A, (from an unknown manufacturer,) power supply was chosen. The C-Note enclosures were assembled, as per the directions, in about two days, and tested with the amplifier and power supply, Using the Panasonic WM61A as a Measurement Microphone. Besides meeting the frequency response and sound intensity specification at 1 meter, the distortion characteristics were impressive-at 100 dB SPL at 1 meter the distortion, (THD,) measured -55 dB, (total loopback: using a Linux PC as a signal source; through the amplifier; through the speakers; through the microphone; through a mixer/bridge; and back to the PC for FFT distortion analysis.) The test results were beyond the capability of the test setup, (particularly the non-linearites of the WM61A electret microphone at these levels,) and indicate that the C-Note speaker, at 100 dB SPL @ 1 meter was capable of producing a THD somewhat around/below -60 dB = 0.1%. The magnitude of the harmonics of an EBU R68-2000 0 dBFS, 997 Hz. alignment signal which fall in the most sensitive frequency range of human hearing of the Fletcher-Munson curves, (about 2 kHz. to 5 kHz.,) were:
actual test data, 15' X 16' non-acoustically treated room, as measured in the test setup with the Baudline Fast Fourier Transform program, (level ~ 0 dBFS ~ 100 dB SPL @ 1 meter.) Spice Analysis of the C-Note Speaker:The optimal maximally-flat enclosure volume for the DSA135-8 5" woofer is about 6.6 liters, with an enclosure resonant frequency, Fb, of 55 Hz., (and an F3 of 56 Hz.) Referring to the manufacturer's data, the C-Note speaker has an impedance minima of about 40 Hz., (meaning Fb ~ 40 Hz.,) and a physical enclosure volume of about 9 liters, (about 8.5 to 8.75 liters acoustical volume,) extending the F3 of the C-Note speaker to 43 Hz. Using these parameters, the complete C-Note speaker system, (including crossovers,) were simulated using gEDA and ngspice as a design environment. The design database is available as a tape archive, c-note.tar.gz, to facilitate replication of the design.
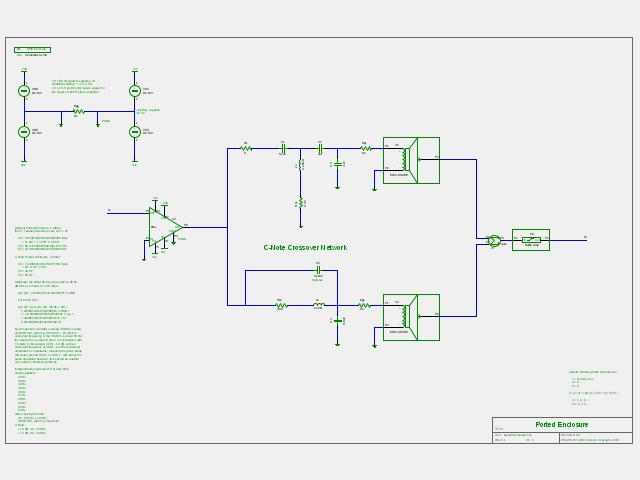
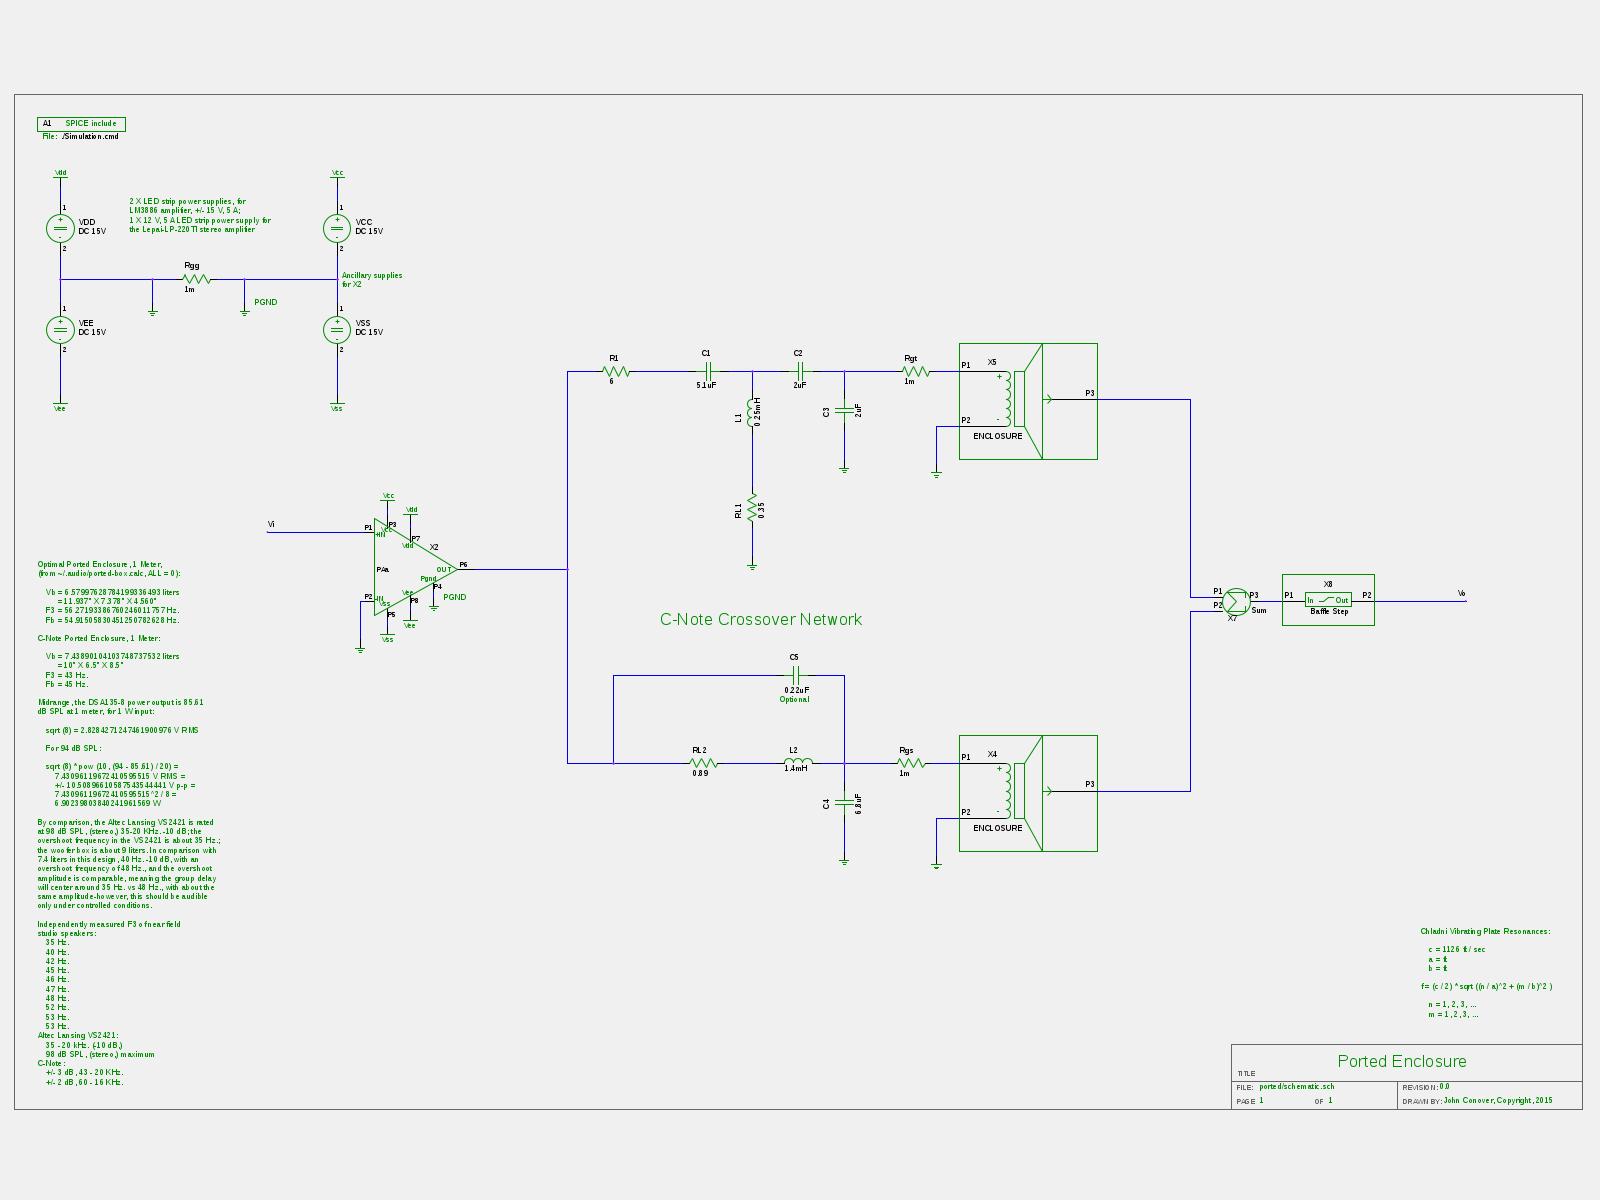
Figure I. Schematic of the C-Note Speaker SimulationFigure 1, (1600X1200,) is the schematic of the C-Note speaker used in the simulation. Note that the mid-range woofer, tweeter, crossover, and baffle step are simulated. Both of the speaker drivers are simulated using slightly modified Thiele/Small parameters. The parameters were modified for better agreement at high frequencies with the individual driver's FRZ data.
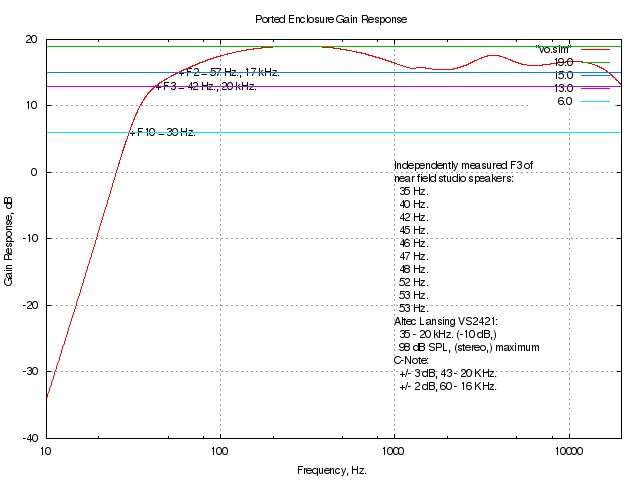
Figure II. Simulated Frequency Response of the C-Note SpeakerFigure 2 is the simulated frequency response of the C-Note speaker. By comparison, see: C-Note Crossover Schematic with Frequency Response, (or, independent measurement by Jan Schaafsma, February 2, 2018, in the Reviews section of the C-Note page at the Parts Express site.) Also, for comparison, the low frequency response data for independently measured popular commercial studio monitors was collected from around the Internet, including the Altec-Lansing VS2421 specification, which is a popular computer gaming audio system.
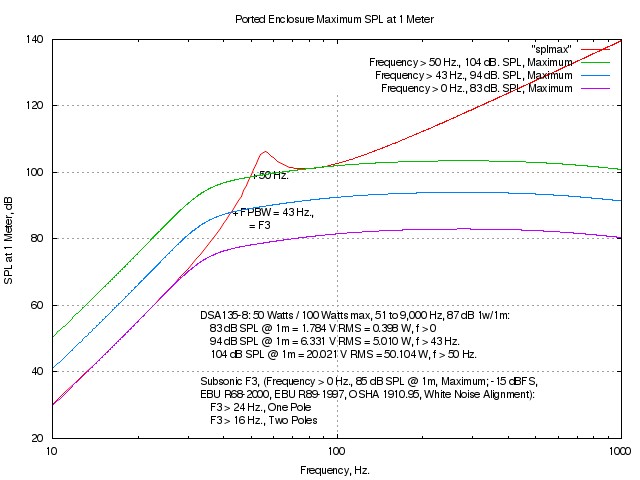
Figure III. Simulated Maximum SPL Response of the C-Note SpeakerFigure 3 is the simulated maximum SPL response of the C-Note speaker. The speaker is a ported design, and very low frequency de-coupling of the woofer driver cone limits the maximum SPL of the speaker. The speaker is capable of producing full power, 100 dB SPL @ 1 meter, down to its low frequency cut off-the low frequency full power bandwidth, (FPBW,) is about 43 Hz., and subsonic filters would probably not be required, except in very critical applications. (The C-Note speaker is capable of producing white noise signals at levels of 83 dB SPL @ 1 meter without subsonic filters.)
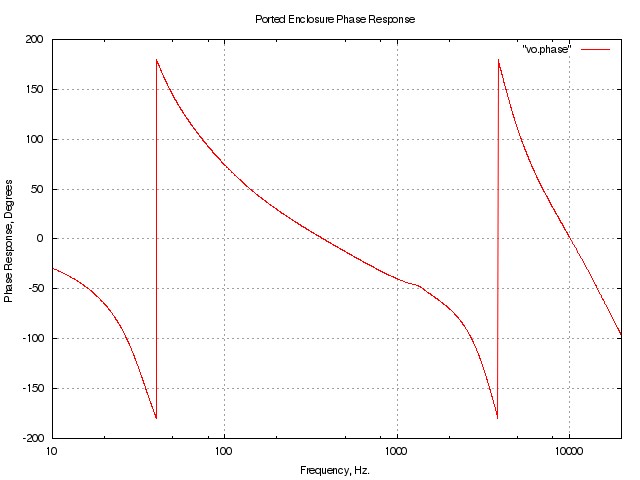
Figure IV. Simulated Phase Response of the C-Note SpeakerFigure 4 is the simulated phase response of the C-Note speaker.
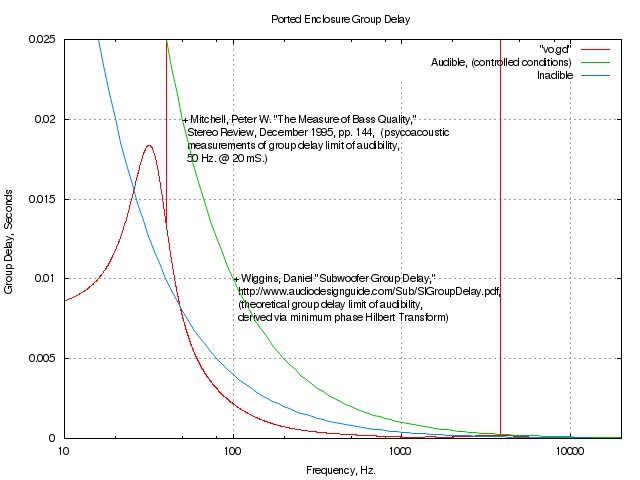
Figure V. Simulated Group Delay of the C-Note SpeakerFigure 5 is the simulated group delay of the C-Note speaker. The graph has two data points, one rather theoretical, one empirical, (which are in reasonable agreement,) showing the limits of audibility of group delay in speaker systems. The C-Note speaker group delay would be audible only under extremely controlled conditions, (i.e., an acoustically treated room.)
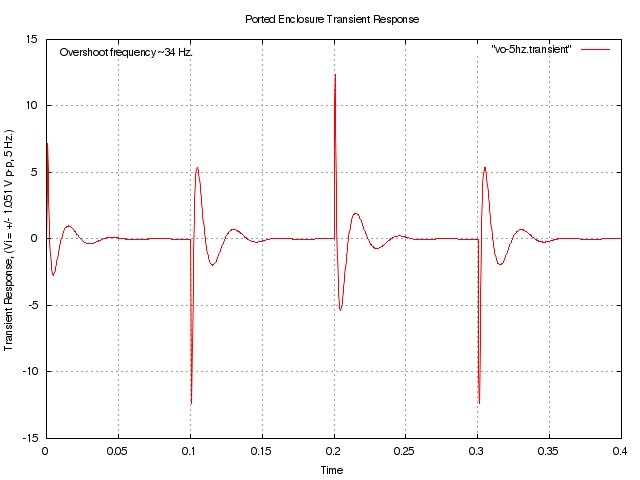
Figure VI. Simulated 5 Hz. Transient Response of the C-Note SpeakerFigure 6 is the simulated 5 Hz. transient response of the C-Note speaker. This would sound like 5 Hz. "clicks" due to the high pass characteristics of speakers, (any speakers will sound like this, unless the room is very small, and completely sealed-i.e., adiabatic compression.)
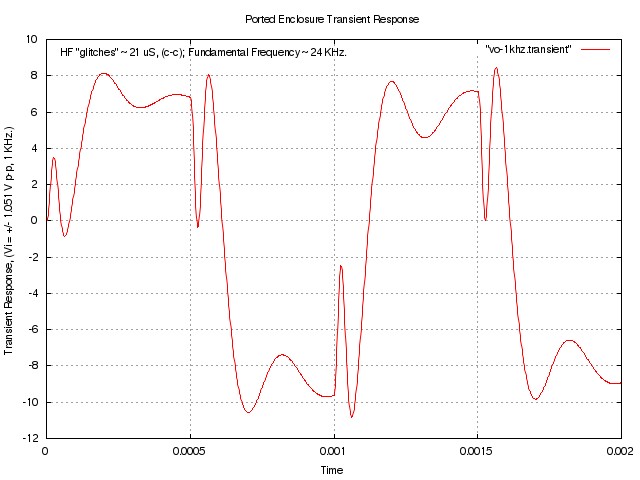
Figure VII. Simulated 1 kHz. Response of the C-Note SpeakerFigure 7 is the simulated 1 kHz. response of the C-Note speaker. Note the time alignment between the tweeter transient and leading edge of the woofer transient. This may, or may not, exist-the acoustic centers of the two drivers are not known, (but if they were, they could be modeled as a spice time delay.) But, if they do exist, the transient fundamental is about 21 uS, (24 kHz.,) probably beyond human audibility.
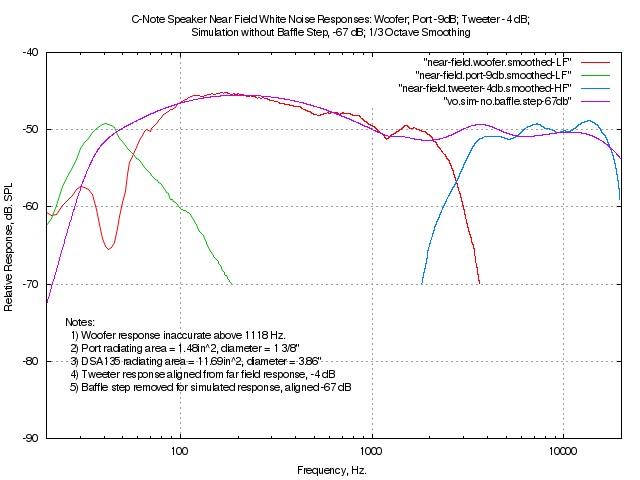
Figure VIII. Measured Near Field Frequency Response of the C-Note SpeakerFigure 8 is the measured near field frequency response of a
single C-Note speaker. The WM61A electret element was placed
about 1/8" from the center of the woofer and tweeter driver
dust caps, and in the plane of the rear of the speaker
enclosure at the center of the port. The DSA135 woofer maximum
frequency for the near field measurement is
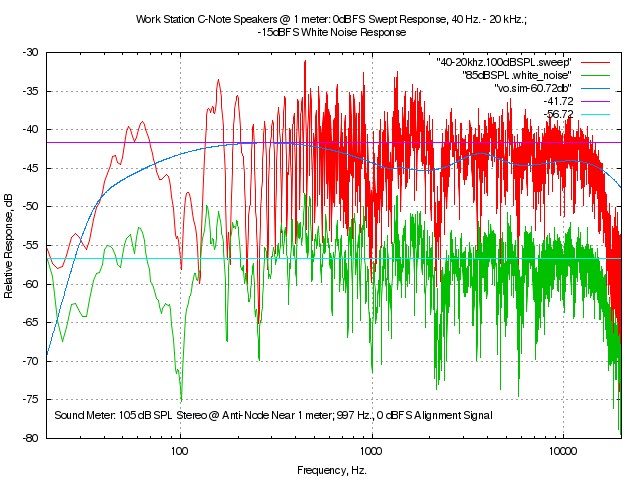
Figure IX. Measured Frequency Response of the C-Note SpeakerFigure 9 is the measured stereo frequency response of the C-Note speakers. The data is not smoothed. There are two plots: 100 dB SPL @ 1 meter, 40 to 20 kHz. frequency sweep; and, 85 dB SPL @ 1 meter, 0 to 20 kHz. white noise. Frequency is logarithmic scale. The room environment where the measurement was made is far from optimal, and is typical of a SOHO office or computer work/gaming station scenario. The room has no acoustical treatment of any kind, (i.e., has a large glass window, large white board, uncovered wood floors, two solid wood closet doors, uncovered wood door, large wood desk, computer stand, printer stand, etc.,) and is about 19' X 11' X 8' physical dimensions, all orthogonal; the area of all walls/ceiling/floor is about 83.5 square meters. The speakers were about 33" apart, with the center of the speakers about 43" from the floor, and the speaker rear-firing port about 2" from the 'X' axis wall, (e.g., standard stereo equilateral triangle to the microphone.) Increasing the size of the stereo equilateral triangle, (to about 2 meters on an edge,) alleviates the 100 Hz. "hole" in the frequency response, somewhat, and offers improved sound stage presentation.
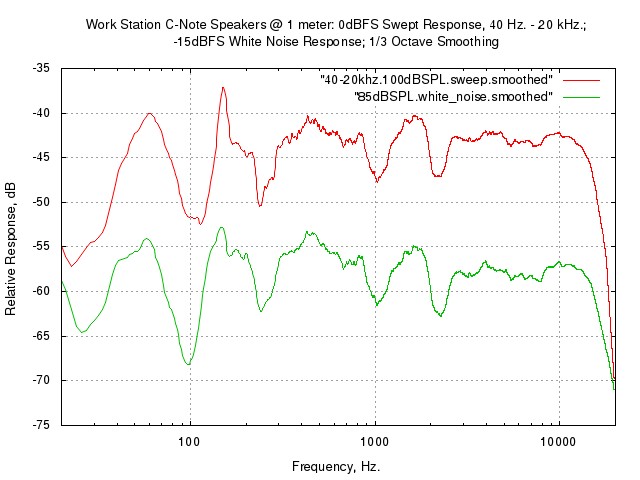
Figure X. Smoothed Frequency Response of the C-Note SpeakerFigure 10 is the smoothed stereo frequency response of the C-Note speakers, (same data as Figure 9.) Averaging smoothes the interference notches and peaks and typically 1/3rd octave smoothing is applied. Human hearing integrates sounds in 1/3rd octave bands. There are two plots: 100 dB SPL @ 1 meter, 40 to 20 kHz. frequency sweep; and, 85 dB SPL @ 1 meter, 0 to 20 kHz. white noise. The smoothing was done with the osmooth program from the osmooth.tar.gz tape archive. Frequency is logarithmic scale. By comparison, see: Sean Olive's Audio's Circle of Confusion, Figure 2, for examples of the in-room frequency response of studio monitors in professional recording studios. Note the similar low frequency interference notches, albeit reduced through acoustic treatment of the studios. The interference notch at about 100 Hz. in Figure 10 is created by the floor-ceiling interaction of reflected sound waves with the direct sound wave generated by the C-Note speaker. (It is not a characteristic of the speaker-it is a characteristic of the room.)
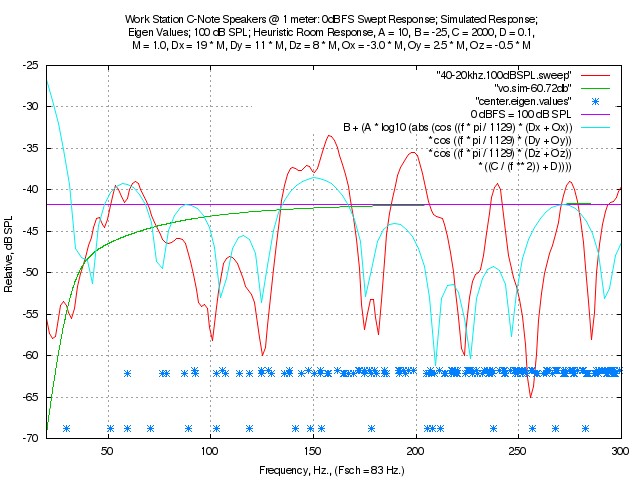
Figure XI. Measured Low Frequency Response of the C-Note SpeakerFigure 11 is the measured low frequency response of the C-Note speaker, (same data as Figure 9.) The frequency is linear scale. In addition, the heuristic Room Acoustics is plotted, including the Eigen values at the center of the room, (the antinodes are the bottom "dots," minimum pressure, oblique mode; the top "dots," axial mode, the middle "dots," tangential mode.) The Schroeder cutoff frequency is about 83 Hz., above which, the accuracy deteriorates rapidly. The listener's position, (microphone placement,) was offset from the center of the room, (the values in the 'O' parameters.)
The point is that the C-Note speaker is probably much better than the sound qualities of any rectangular room its put in, (acoustically treated, or not,) and has similar characteristics to the better commercial studio monitors, including low distortion.
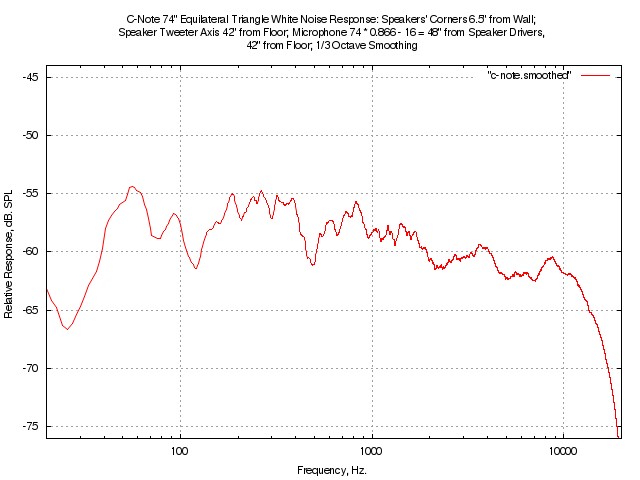
Figure XII. Smoothed Frequency Response of the C-Note SpeakerFigure 12 is the 1/3 octave smoothed stereo frequency response of the C-Note speakers, after the left and right speakers are moved 74" apart, for comparison with Figure 2 of Sean Olive's Audio's Circle of Confusion. The two frequency response graphs are about the same size, in both abscissa and ordinate. The signal noise level was 85 dB SPL @ 48", and there were 32768 frequency bins. Frequency in both graphs is logarithmic scale. No other changes to the room, other than the speaker separation, was made, (i.e., speaker separation changed from 33" in Figure 10, to 74" in Figure 12.) It is important to note that the comparison is not fair-the studio monitors in professional recording studios are expensive, (several thousands of dollars, each,) and the acoustic treatment in the professional recording studios can run into the millions of dollars. The C-Note speaker acquitted itself well, under the circumstances of very poor acoustic environment, (if the ceiling in the room was 12' instead of 8', it would be the worst of all possible scenarios-a room shaped like a cube, not to mention all the hardwood tables and floor.) Nonetheless, the C-Note speaker came within about 2 to 3 dB of the median of the professional environments.
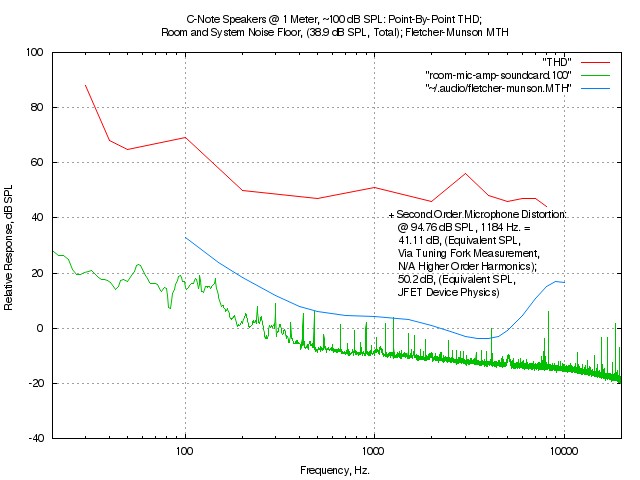
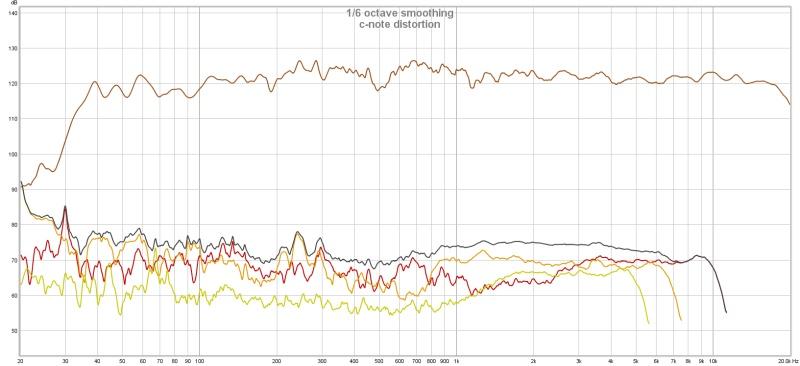
Figure XIII. Measured Distortion of the C-Note SpeakerFigure 13 is the measured distortion of the C-Note speaker at about 100 dB SPL @ 1 meter. The measurements were made Using the Panasonic WM61A as a Measurement Microphone. Notice that the measurements were made at the limits of the capability of the test system, (its not clear whether the microphone distortion, or speaker distortion, was measured.) For comparison, the Fletcher-Munson curves of the MTH, (Minimum Threshold of Hearing,) as a function of frequency are included. The Fletcher-Munson MTH at 25 Hz. is about 65 dB SPL. See, also, independent measurement by Jan Schaafsma, February 2, 2018, in the Reviews section of the C-Note page at the Parts Express site, with similar results of the THD about 50 dB below the fundamental. (The human hearing limit of discernible distortion is about 3%, or, -30 dB below the fundamental @ 5 kHz., raising to about zero dB at 20 Hz. Ref: How Much Distortion Can We Hear With Music?.) The amplifier used in all tests was the Lepai LP-2020TI based on the TPA3118 chip and chosen for its low distortion characteristics, and adequate output power on a single 12 V 5 A LED power supply. The measured distortion for an EBU R68-2000 0 dBFS = 100 dB SPL, 997 Hz. alignment signal was -67 dB THD into an 8 Ohm load per channel, corresponding to an equivalent 33 dB SPL. The TPA3116D2 2x50W Class D Stereo Amplifier Board with Volume Control was also tested, and had almost identical frequency and distortion characteristics. (Many different amplifiers were collected from the Internet stores, ranging in price from US $2 to US $30, and the TPA311X based devices were usually, but not always, superior-approaching the low distortion capabilities of the LM3886 based devices, which require bipolar power supplies.) The amplifier distortion was well below the speaker and/or microphone distortion in the measurements. Replicating the Spice Analysis of the C-Note SpeakerTo replicate the analysis in its entirety, Debian Linux, versions 7, 8, or, 9, will be required with Ngspice, the Baudline FFT time-frequency browser, Gnuplot, GNU Emacs, GNU RCS, gEDA and, Calc programs, all of which are available from one's favorite Linux repository. (Other programs required are the "standard" Unix/Linux utilities, installed with one's choice of Linux distributions.) Quick Start:
Which should generate all files portrayed above, leaving a clean directory. Additional actions in the c-note/ported/ directory:
For further information, see c-note/ported/Makefile. File Structure of the c-note/ directory:
LicenseA license is hereby granted to reproduce this design for personal, non-commercial use. THIS DESIGN IS PROVIDED "AS IS". THE AUTHOR PROVIDES NO WARRANTIES WHATSOEVER, EXPRESSED OR IMPLIED, INCLUDING WARRANTIES OF MERCHANTABILITY, TITLE, OR FITNESS FOR ANY PARTICULAR PURPOSE. THE AUTHOR DOES NOT WARRANT THAT USE OF THIS DESIGN DOES NOT INFRINGE THE INTELLECTUAL PROPERTY RIGHTS OF ANY THIRD PARTY IN ANY COUNTRY. So there. Copyright © 1992-2018, John Conover, All Rights Reserved. Comments and/or problem reports should be addressed to:
|
Home | John | Connie | Publications | Software | Correspondence | NtropiX | NdustriX | NformatiX | NdeX | Thanks