| john@email.johncon.com |
| http://www.johncon.com/john/ |
|
|
|
||
Using the Panasonic WM61A as a Measurement Microphone |
|||
Home | John | Connie | Publications | Software | Correspondence | NtropiX | NdustriX | NformatiX | NdeX | Thanks
|
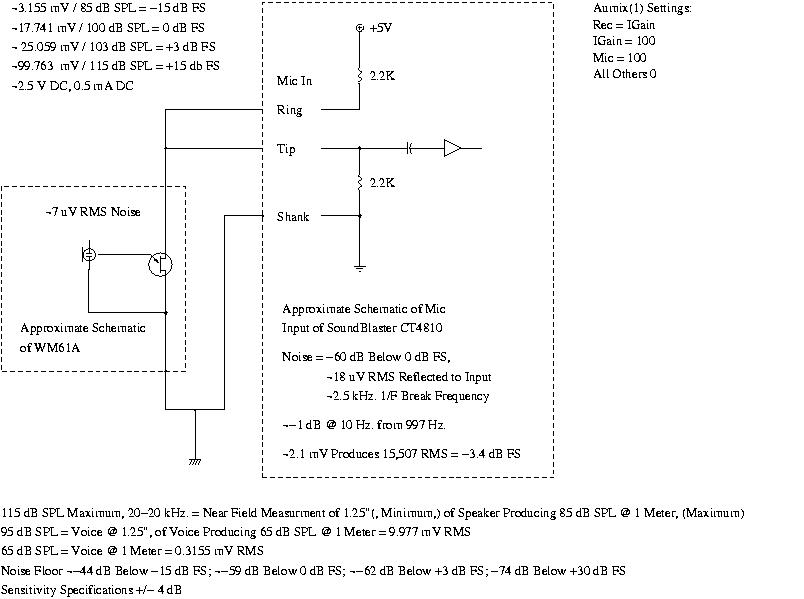
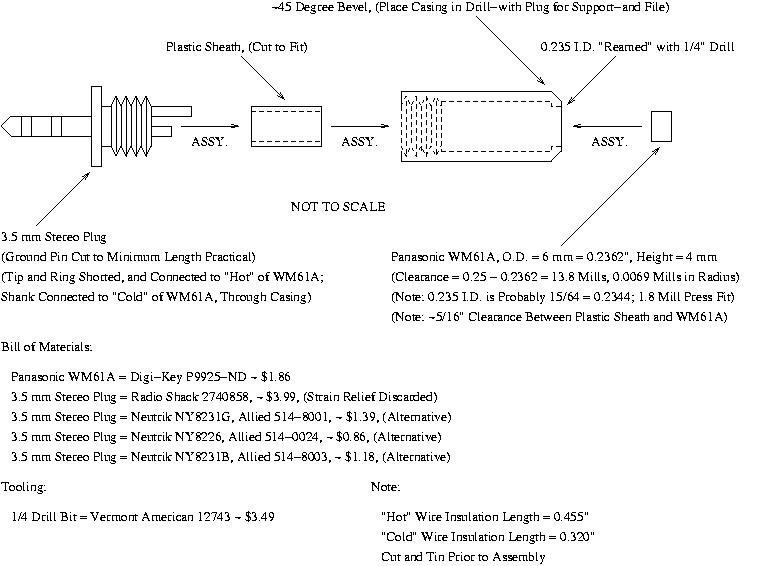
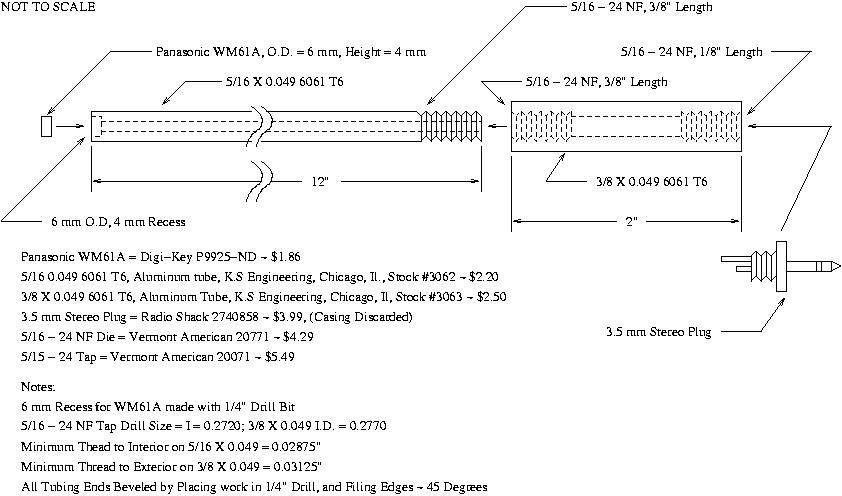
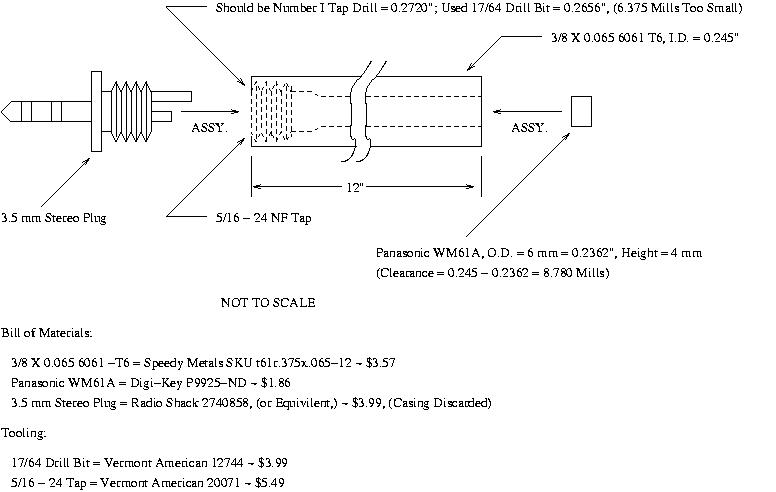
Measurement microphones are an indispensable tool for the musician and sound/recording engineer. Measurement microphones differ from recording microphones and sound meters-they have a flat response, (usually to well below 20 Hz., and above 20 kHz.,) and do not have "weighted," or equalized frequency response. They are also optimized for measuring high SPL sound intensity, (for example, measurements taken at fraction of an inch from a speaker driver-to measure speaker response.) Measurement microphones retail for US $100 to over US $500, but very adequate measurement microphones can be made using the Panasonic WM61A back electret microphone cartridge, which can be purchased through Digi-Key, part number P9925-ND, for under US $2.00, each. For simple measurements, (i.e., for measuring SPLs greater than 65 dB, and less than 100 dB,) the WM61A, can be interfaced directly to a PC's sound card: 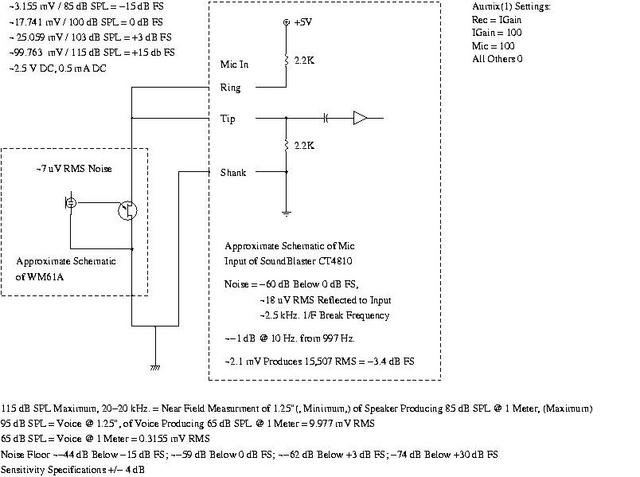 Figure I. Interfacing the Panasonic WM61A Electret Microphone to the SoundBlaster CT4810 PC Sound CardFigure I, (which is available in larger size jpeg, or xfig, format,) is a partial schematic for interfacing the Panasonic WM61A Electret Microphone cartridge to the SoundBlaster CT4810 PC Sound Card, including approximate signal voltage levels. The WM61A is quite small, (6 mm in diameter, 4 mm height,) and a suitable case is required for handling-which can be made out of a 3.5 mm stereo plug:  Figure II. Construction of a Measurement Microphone Using the Panasonic WM61A Electret CartridgeFigure II, (which is available in larger size jpeg, or xfig, format,) shows the construction of a Measurement Microphone using the Panasonic WM61A Electret cartridge. The electret cartridge should be covered with silicon sealant, (I use GE's Silicon II, Household Glue-which is available in the paint department of home improvement centers,) taking special care that none of the sealant gets on the black cloth cover of the cartridge-the cartridge-to-case should be an air tight seal. The wires should be soldered to the cartridge first, cut to length, and soldered to the plug-and the length checked by screwing the plug/cartridge into the casing, then the sealant applied, and the microphone assembled, (there are pictures, below, that show how to drill the hole for the cartridge, etc.) The measurement microphone is specified at -35 dB +/- 4 dB, (0 dB = 1 V / Pa,) with an load resistance of 2.2K, and 1 Pa is 94 dB SPL, or 94 dB SPL produces 18 mV across the 2.2K load resistance, (9 mV across two 2.2K resistors in parallel = 1.1K.) Note: with a load resistance of two 2.2K resistors in parallel, (or 1.1K,) and the tip and ring shorted, 100 dB SPL produced a measured 12.7 mV signal at input to the sound card, which corresponded to, approximately, 0 dB FS.
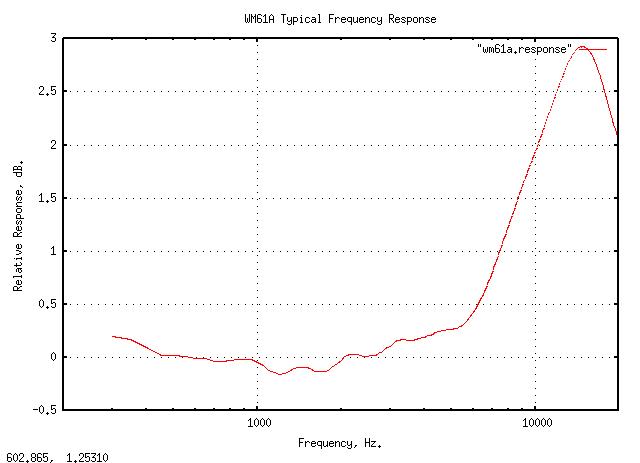
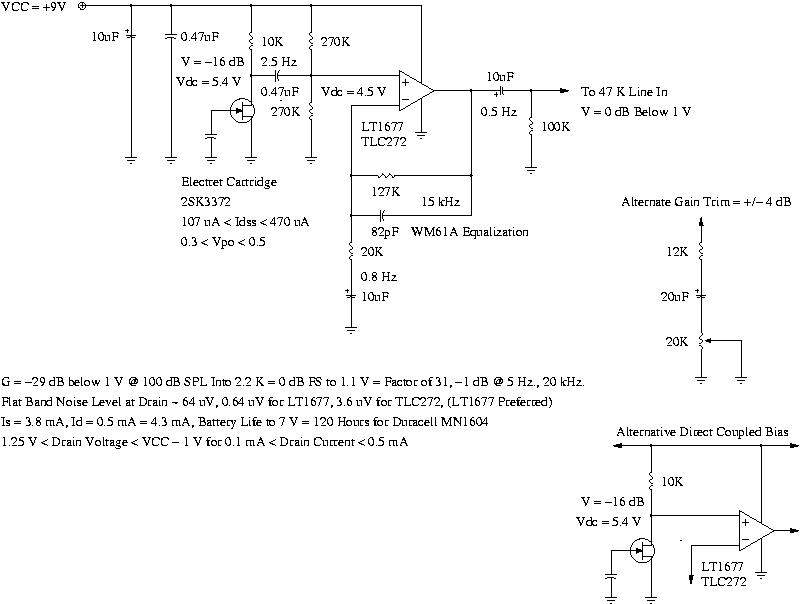
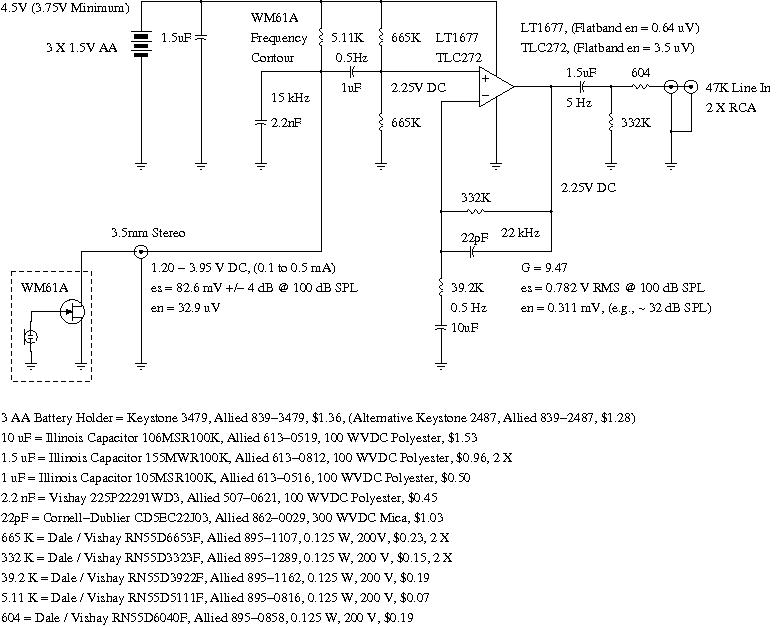
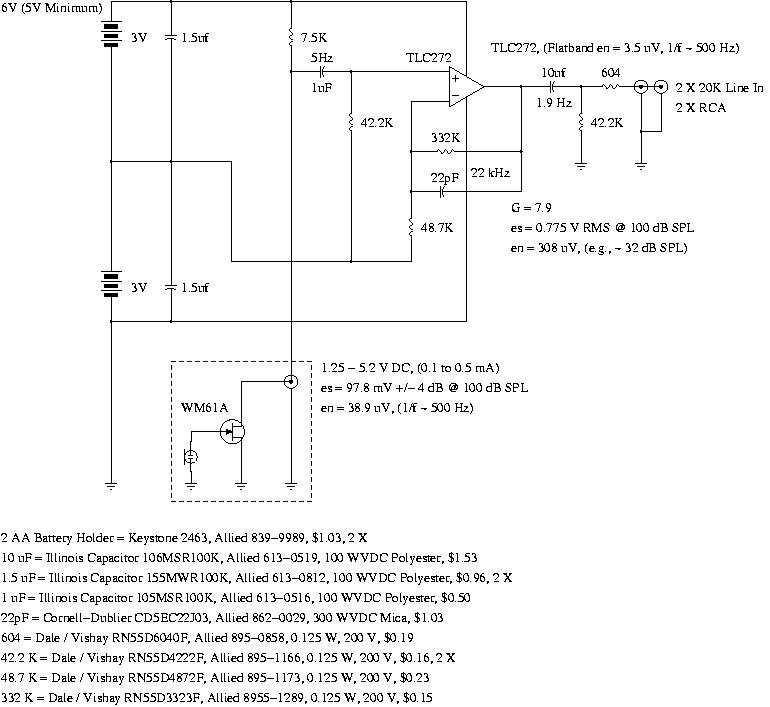
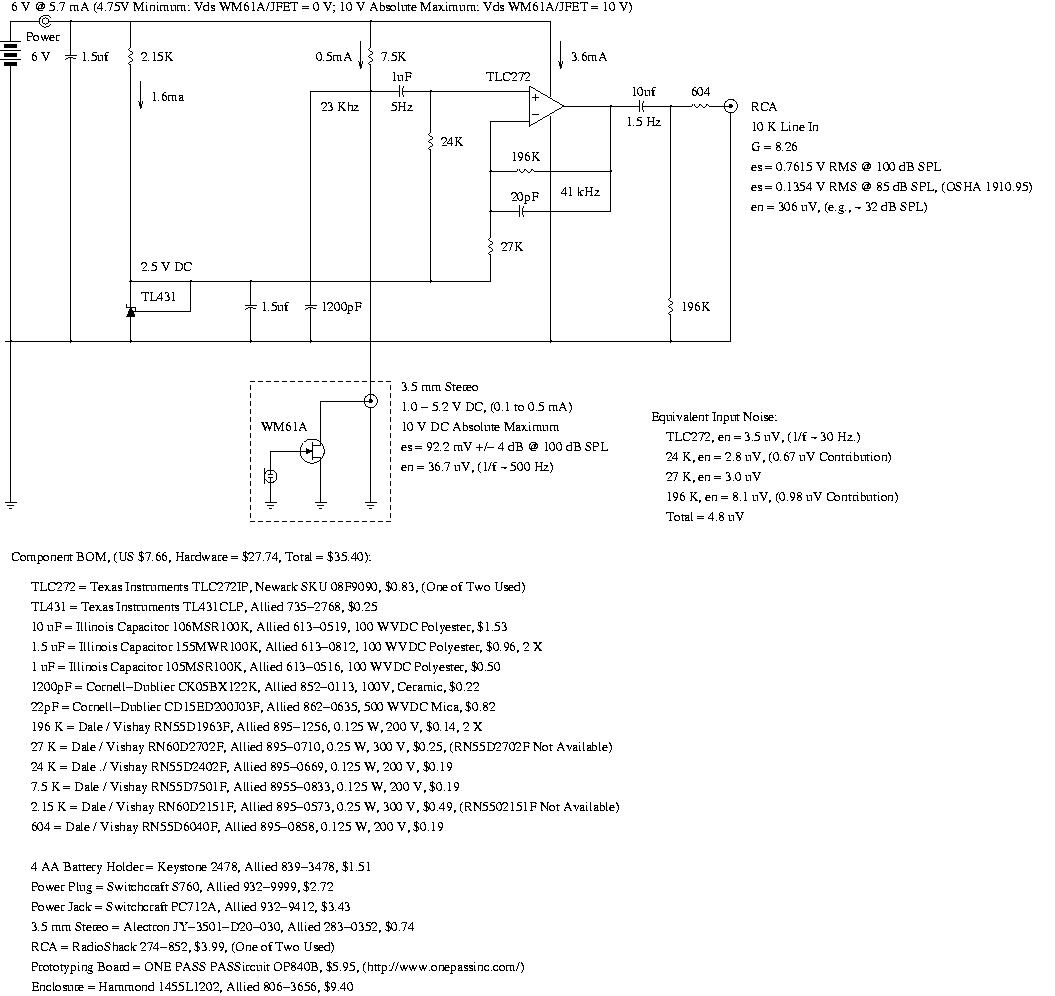
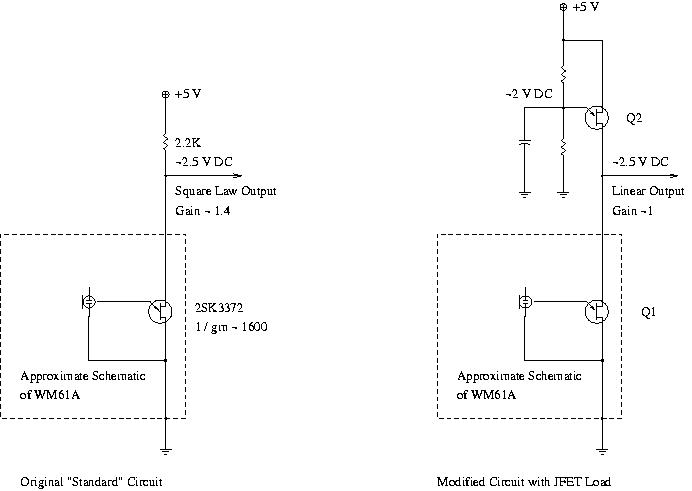
Figure III. WM61A Typical Frequency ResponseFigure III is a plot of the frequency response of a typical WM61A. Note that the unequalized response is flat to +/- 1.5 dB to 20 kHz. However, there appears to be a zero in the transfer function at about 15 kHz., (causing the response to be high by about 1 dB at 7.5 kHz., which could be canceled in the amplifier response to about 15 kHz.) The microphone is quite good, (within its SPL limitations,) and works well with the truly outstanding Baudline FFT time-frequency browser designed for scientific visualization of the spectral domain, and Xoscope, turning the PC into an audio analysis system. Ray Carlisle has developed a Spice circuit simulation model for the WM61A electret microphone using LTSpice, which is a free download from Linear Technology. The simulations agree reasonably well with the empirical measurements on the microphone. Ruslan Migirov contacted the Panasonic corporation, and the FET part number for the Japanese version of the WM61A is 2SK123. For the US version of the WM61A, the FET part number is 2SK33720RLCT-ND. An Amplifier for the Panasonic WM61A Electret Microphone: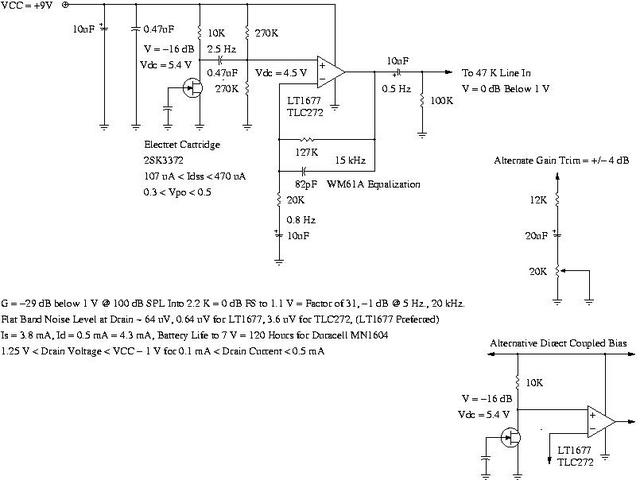 Figure IV. Schematic of the Amplifier for the Panasonic WM61A Electret MicrophoneFigure IV, (which is available in larger size jpeg, or xfig, format,) is the schematic of the amplifier for the Panasonic WM61A Electret Microphone. Almost any operational amplifier will suffice since the JFET gain is quite high, (so amplifier noise is not a significant issue,) but the Linear Technology LT1677 is a good choice because of its common mode input range, (allowing lower batter voltage and longer battery life, without running out of head space,) with good noise performance, quiescent current requirements, single rail operation, and good 1/f noise characteristics. They are available on the Linear Technology site for under US $3.00, each. A less expensive alternative is the TLC272 from Texas Instruments. It is a dual, (the other channel is not used-and may be used as a gain control, etc.,) and is available from Newark for under US $0.90, each. It is a linear CMOS design, and has inferior noise performance , (particularly 1/f noise-which has a break frequency in the several hundred Hz. range,) compared to the bipolar LT1677, but may be acceptable for high SPL measurement microphones. The TLC272 can also drive line levels, (i.e., 0dBu = 0.775 V RMS across any load, 0dBm = 0.775 V RMS across 600 Ohms = 1 mW = -15 dB FS, as per EBU R68 with a series 600 Ohm resistor in the output to set the line out impedance, driving 1200 Ohms total.) The amplifier circuit is adaptable-the only modification for different supply voltage operation is determination of the JFET load resistor. It should be selected such that the worst case minimum idss, (107 uA, for the 2SK3372 JFET,) should pull the voltage across the load resistor down at least 1.0 V below the rail for common mode input operation of the operational amplifier. Likewise, the worst case maximum idss, (470 uA, for the 2SK3372 JFET,) should not pull the voltage across the load resistor to lower than about 1.25 V above ground, for all values of supply voltage, (as the battery runs down, which sets battery life.) This is a very conservative circuit design over manufacturer's make parameters. An alternative electret cartridge interface is shown that is DC coupled to the operational amplifier, and eliminates a capacitor and two resistors. The WM61A data sheet does not offer worst case temperature characteristics, so ambient temperature range performance of the DC coupled bias circuit can not be determined. Also shown is a simple gain trim, (for the +/- 4 dB gain tolerance of the WM61A,) that replaces the 20 K resistor and 10 uF capacitor in the operational amplifier's feedback lower leg. 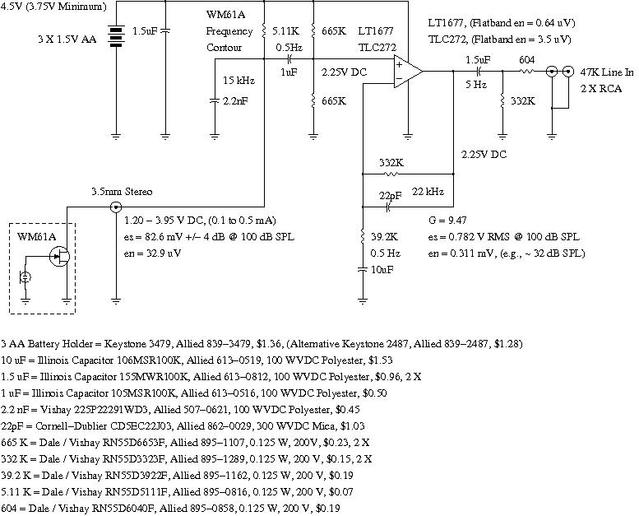 Figure V. Complete Schematic of the Amplifier for the Panasonic WM61A Electret MicrophoneFigure V, (which is available in larger size jpeg, or xfig, format,) is the complete schematic of the amplifier for the Panasonic WM61A Electret Microphone. The component bill of materials is about US $10, and all components are available on line. Note the use of 4.5 V, (3 X AA batteries-which can be rechargeable, offering several hundred hours of operation between charges,) and the absence of electrolytic capacitors, (for the reasoning, see Direct Coupled Stereo Headphone Amplifier.) Note, also, that no component is stressed to more than 50% of its rated value-the circuit should have excellent reliability/MTBF characteristics. Alternatively, the power could be provided by the PC sound card, (5 and 12 Volts are available from the joystick socket, which should be down regulated and filtered on-card, to remove the hash on the PC power supply busses.) Also, if 6 Volts can be used, (4 X AA batteries,) a 3 Volt tap can be used for an artificial ground for the operational amplifier, eliminating several components, (including the 10 uF polyester capacitor-which is the most expensive, and largest, component in the schematic.) 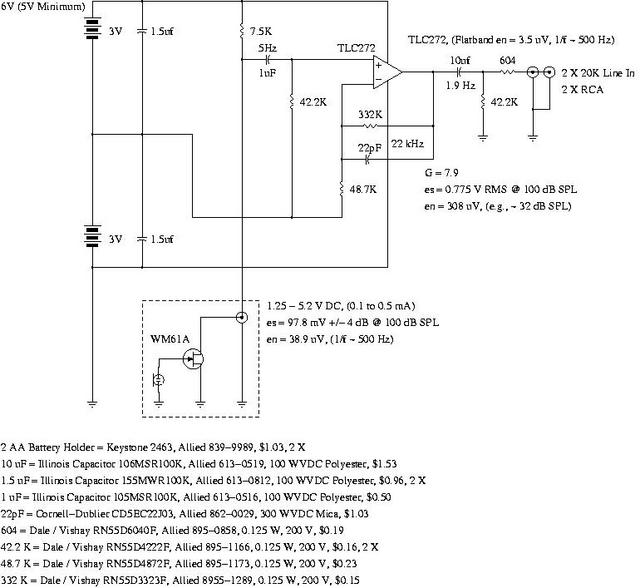 Figure VI. Alternative Schematic of the Amplifier for the Panasonic WM61A Electret MicrophoneFigure VI, (which is available in larger size jpeg, or xfig, format,) is the alternative schematic of the amplifier for the Panasonic WM61A Electret Microphone. The component bill of materials is a little less than US $10, and all components are available on line. The 1/f noise break frequency of the WM61A cartridge is about 500 Hz., (as measured by Baudline,) which is about the same as the TLC272, making the noise contributed by the operational amplifier inconsequential. This is probably the simplest schematic possible for a high quality amplifier. 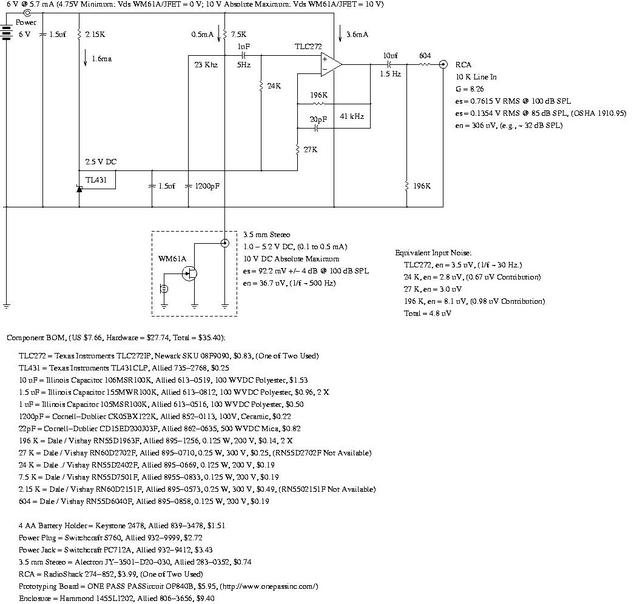 Figure VII. A More Elaborate Schematic of the Amplifier for the Panasonic WM61A Electret MicrophoneFigure VII, (which is available in larger size jpeg, or xfig, format,) is a more elaborate schematic of an amplifier for the Panasonic WM61A Electret Microphone. The component bill of materials is still less than US $10, (and all components are available on line, and substantial savings could be made in hardware-the hardware BOM consists of fairly high quality components that are easy to work with,) and uses a TL431 shunt regulator to provide a stable, above ground, reference for the operational amplifier. Only one of the TLC272 dual operational amplifiers are used, (if the other is not used, for gain/volume control, etc., it should have its inverting input connected to its output, and its non-inverting input connected to the output of the TL431.) A gain trim can be added by reducing the value of the 27 K resistor, and adding a potentiometer connected as a rheostat, (with the wiper and cold end shorted together, and connected to the output of the TL431. Note that the bandwidth is limited at the input, (directly from the WM61A cartridge,) with poles at 5 Hz. to 22 kHz. The other two poles, (output coupling and limiting the bandwidth of the amplifier in the feedback loop for overshoot/stability considerations,) are at least a half decade from the band limiting poles. As an alternative power supply, the amplifier can use a regulated 5 Volt "Wall Wort," (an after market universal battery charger for portable electronics,) for fixed installations. Note there are substantial variations in the amplifier design-for example, the WM61A has a low enough frequency response to be used as a geophone/seismometer for intrusion/occupancy detection, (either buried, or mounted on a wall/floor to detect vibrations,) in which case a direct coupled configuration would be preferred-to pass low frequency information to a computer for analysis. Linearizing the Panasonic WM61A Electret Microphone:There are several alternatives for removing the SPL limitations of the Panasonic WM61A. Siegfried Linkwitz removes track from the cartridge, (which is an intricate procedure,) and adds source degeneration to the JFET amplifier transistor in the cartridge. Ideally, it should be a constant current source. But there is a simple way to cancel the non-linear distortion products in a JFET amplifier. From semiconductor device physics, the id vs. vgs characteristics of a JFET:
id = idss * (1 - (vgs / vpo))^2
If the load of the JFET microphone amplifier, Q1, is another JFET, Q2, in a cascode circuit topology, (i.e., the load resistor, Rl, which is about 2.2K, replaced with a JFET,) as shown in Figure VIII, below:
id = idss1 * (1 - (vgs1 / vpo1))^2
id = idss2 * (1 - (vgs2 / vpo2))^2
or:
          sqrt (id / idss2) = 1 - (vgs2 / vpo2)
          vgs2 = vpo2 * (1 - sqrt (id / idss2))
          vgs2 = vpo2 * (1 - sqrt ((idss1 * (1 - (vgs1 / vpo1))^2) / idss2))
          vgs2 = vpo2 - (vpo2 * sqrt ((idss1 * (1 - (vgs1 / vpo1))^2) / idss2))
          vgs2 = vpo2 - (vpo2 * sqrt (idss1 / idss2)) * sqrt ((1 - (vgs1 / vpo1))^2)
          vgs2 = vpo2 - (vpo2 * sqrt (idss1 / idss2)) * (1 - (vgs1 / vpo1))
          vgs2 = vpo2 - (vpo2 * sqrt (idss1 / idss2)) -
                 ((vgs1 / vpo1) * (vpo2 * sqrt (idss1 / idss2)))
          vgs2 = vpo2 - (vpo2 * sqrt (idss1 / idss2)) -
                 (vgs1 * ((vpo2 / vpo1) * (sqrt (idss1 / idss2))))
Meaning, the gain, G = vgs2 / vgs1, is linear, and the JFET transistors, Q1 and Q2, do not have to be matched-the only requirement is that idss2 >= idss1, (as a worst case design parameter.) 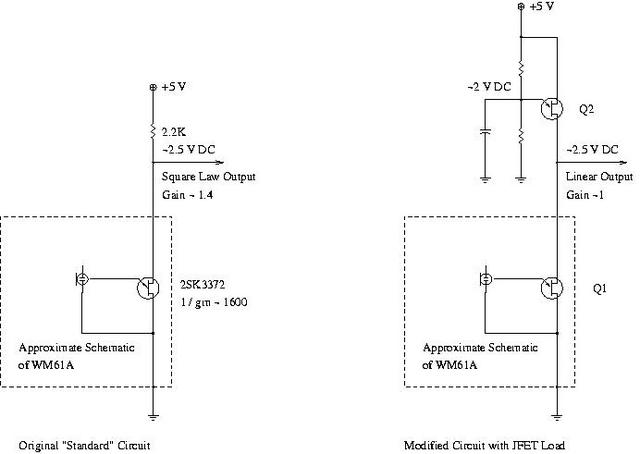 Figure VIII. Linearizing the Panasonic WM61A Electret MicrophoneFigure VIII, (which is available in larger size jpeg, or xfig, format,) is a partial schematic for linearizing the Panasonic WM61A Electret Microphone. From the 2SK3372 JFET data sheet, 107 uA <= idss <= 470 uA, (as a worst case design at 25C-which will be much worse than the +/- 4 dB worst case specification for the WM61A,) and from the typical graph for id vs. vgs, 0.35 V <= vpo <= 0.50 V:
          gm = ((2 * idss) / vpo) * (1 - (2 * vgs / vpo))
          vgs = 0
          gm = ((2 * idss) / vpo)
or, 319 <= 1 / gm <= 2336, or the gain, G, is 2200 / 2336 <= G <= 2200 / 319, or 0.94 <= G <= 6.89. (Note that Panasonic is probably cherry picking the 2SK3372 JFET for +/- 4 dB tolerance, since they manufacture the both the electret cartridge and transistor, so the worst case parameters of idss and vpo are probably pessimistic.) Note that this is an absolute worst-case-design, (in JFETs, the idss and vpo tend to track each other-a low idss associated with a low vpo, and a high idss associated with a high vpo,) so the parameters are much closer; but that is not indicated in the data sheet, and is not used in the worst-case-design scenario. Using a 2N5484 JFET transistor, (available from Newark for about 12 cents,) as an example for the cascode transistor, (1 mA <= idss <= 5 mA, and 0.3 V <= Vpo <= 3 V):
          G = (vpo2 / vpo1) * sqrt (idss1 / idss2)
          G = (vpo2 / 0.35) * sqrt (0.000225 / idss2)
or, 0.088 <= G <= 5.9, estimated worst case at 25C for manufacturing tolerances, (meaning the 2N5484 transistors would have to be cherry picked for low transconductance, i.e., high vpo, and low idss, for noise considerations-which would probably suffice for one off builds of a large dynamic range measuring microphone.) The noise figure of the 2N5484 is about 3 dB, and when coupled with a gain that, worst case, is down by a factor of 10 over the Panasonic reference design, would produce a measurement microphone with poor noise performance and limited dynamic range, (but would have excellent high SPL characteristics.) Note that the overload limit is where the voltage output of the microphone electrostatic diaphragm equals vpo, (shutting the transistor current completely off, at approximately 0.35 V,) or forward biases the transistor's gate-source junction, (at approximately 0.55 V,) and the gain will be linear between these two limits. Reverse Engineering the Panasonic WM61AAssuming there is no source degeneration in the WM61A's JFET:
          id = idss * (1 - (vgs / vpo))^2
             = idss (1 - ((2 * vgs) / vpo) + ((vgs / vpo)^2))

          did / dvgs = gm = idss * ((-2 / vpo) + ((2 * vgs) / (vpo^2)))
If there is no source degeneration, then vgs = 0:
          did / dvgs = gm = - idss * (2 / vpo)
          vpo = - (2 * idss) / gm
From the WM61A data sheet, 0.1 mA <= idss <= 0.5 mA, and the gain is +/- 4 dB. From the 2SK3372 data sheet, the typical gm is 1600, or the gm of the 2SK3372 devices used in the WM61A 1010 <= 1 / gm <= 2536, for +/- 4 dB in gain:
          vpo = (2 * 0.0005) / (1 / 2536) = 2.536, maximum
          vpo = (2 * 0.0001) / (1 / 1010) = 0.202, minimum
Which agrees favorably with the graph in the data sheet for the 2SK3372, (the maximum and minimum vpo are not listed.) The typical gate-source signal would be a factor of (1600 / 2200) less than -35 dB below 1 Volt for 94 dB SPL, or 12.9 mV. The maximum signal before clipping, (i.e., a negative voltage of 0.202 V,) would be 94 + 20 log (.202 / 0.0129) = 118 dB SPL, worst case.
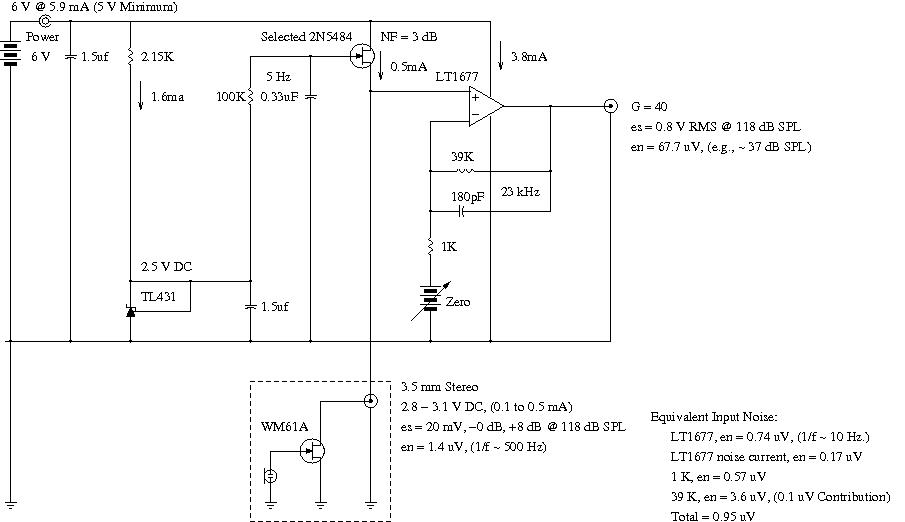
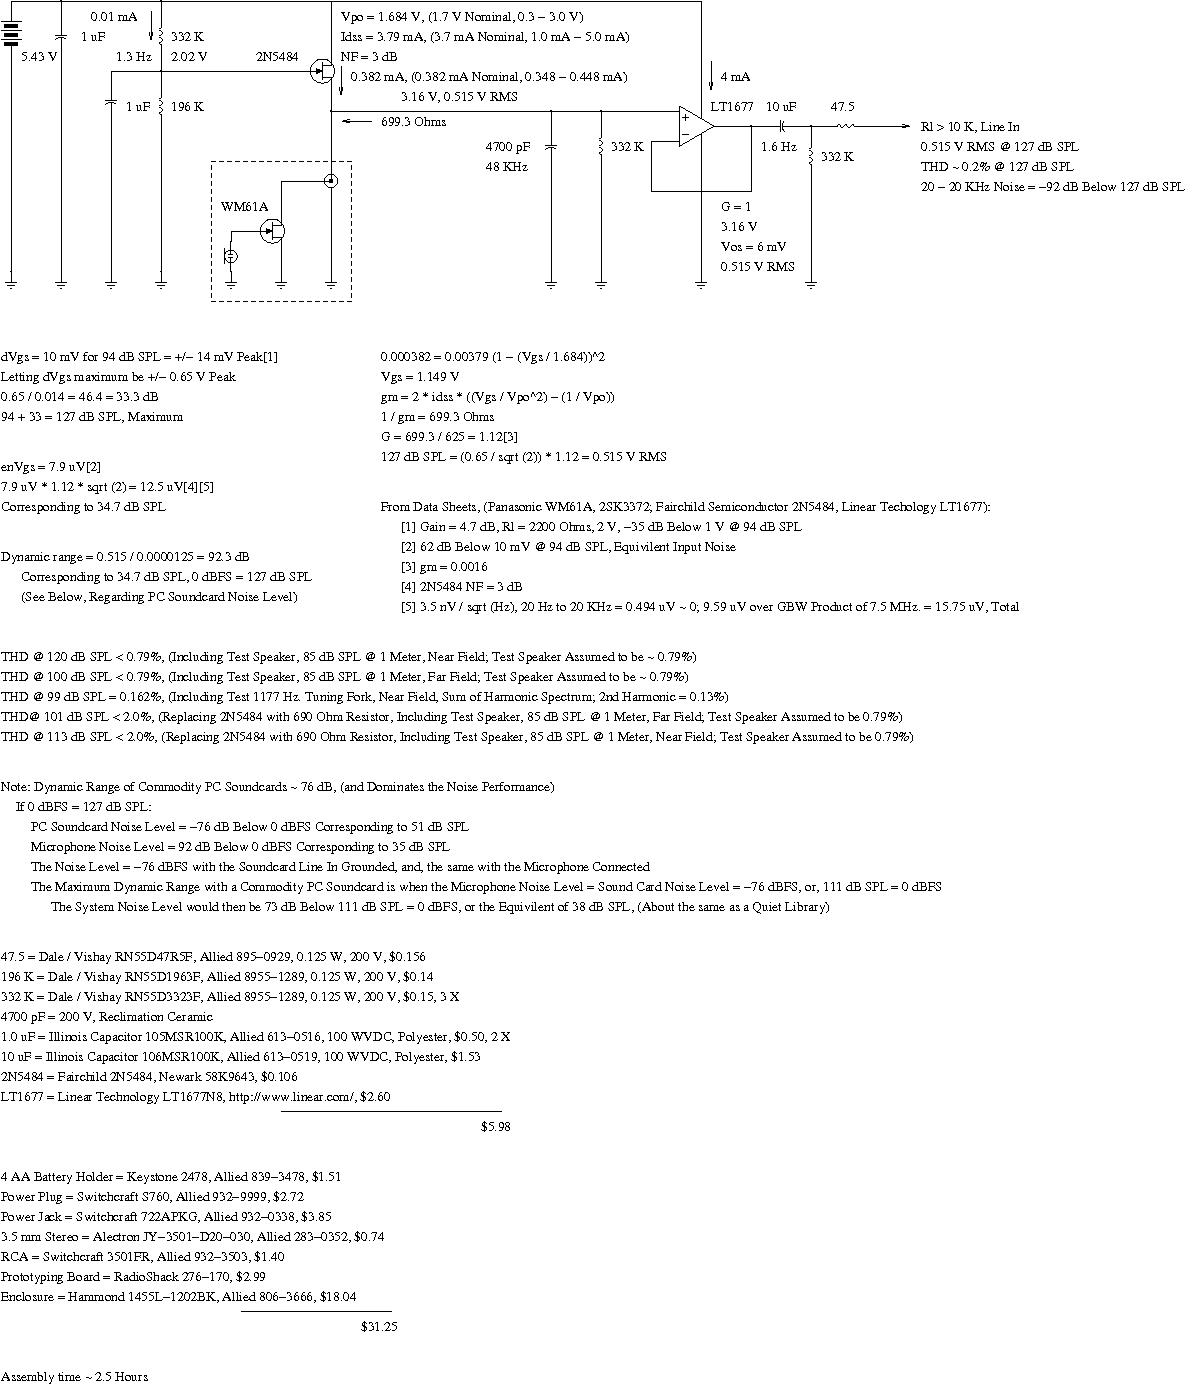
dvgs2 / vgs1 = G = (vpo2 / vpo1) * (sqrt (idss1 / idss2))
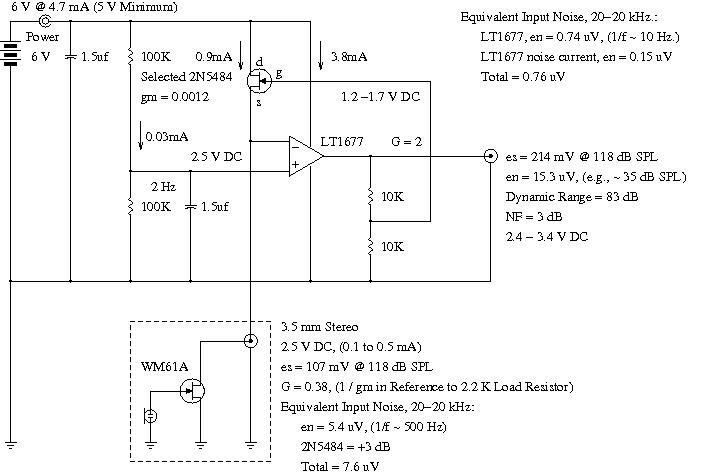
And occurs when vpo2 = minimum, (0.3 V,) vpo1 = maximum, (2.536 V,) idss1 is minimum, (0.107 mA,) and idss2 = maximum, (5 mA,) or G = 0.0173, or for 118 dB SPL, the output voltage of the WM61A would be 0.202 * 0.0173 = 3.5 mV, meaning the 2N5484 cascode transistor would have to be cherry picked. Ten 2N5484s were purchased, (they are very inexpensive,) and idss and vpo measured, and 3.4 mA <= idss <= 4.33 mA, (nominal 3.7 mA,) and, 1.60 V <= vpo <= 1.83 V, (nominal 1.7 V.) Using any of the ten transistors, G > 0.1 or the output voltage of the WM61A would be 0.202 * 0.1 = 20 mV. The noise voltage at the output of the WM61A would be about 86 dB, (62 dB below 94 dB SPL according to the data sheet,) below 20 mV, or about 1 uV. The noise figure of the 2N5484 is 3 dB, or the input noise voltage to the amplifier would be 1.4 uV, giving a dynamic range of 83 dB. 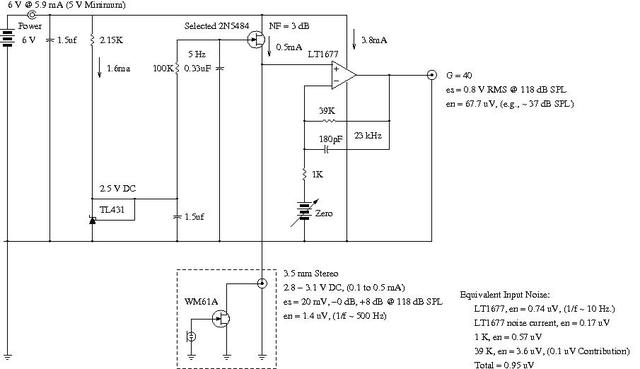 Figure IX. Amplifier for the Linearized Panasonic WM61A Electret MicrophoneFigure IX, (which is available in larger size jpeg, or xfig, format,) is the schematic for the amplifier for the linearized Panasonic WM61A Electret Microphone. Note the usage of Linear Technology LT1677 operational amplifier, (which has an application for the WM61A in the data sheet,) and the direct coupling of the microphone cartridge to the amplifier, (for low frequency considerations.) The amplifier is necessary for noise considerations, and raises the noise level by a little more than 3 dB. At a minimum, the microphone will work, linearly, to 118 dB SPL, which is the maximum, worst-case, that the WM61A is capable of, (cherry picking the microphone cartridge would raise the level to 127 dB SPL, limited by forward biasing the gate-source PN junction.) 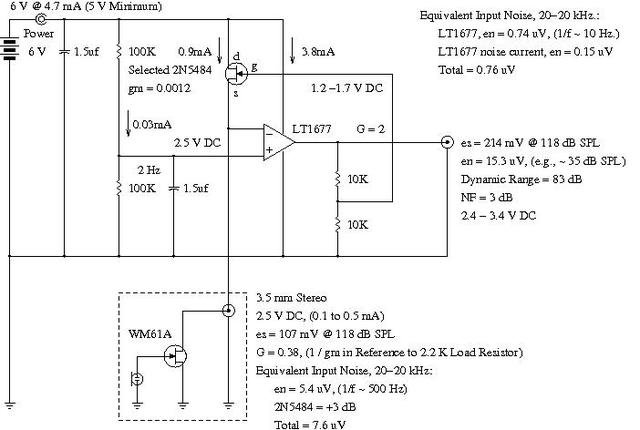 Figure X. Self Biased Amplifier for the Linearized Panasonic WM61A Electret MicrophoneFigure X, (which is available in larger size jpeg, or xfig, format,) is the schematic of a self biased amplifier for the linearized Panasonic WM61A Electret Microphone. Note that the 2N5484 performs an analog square root function, and operates near 0 TC for vgs vs. id, (a diode drop, about 0.7 Volts, is 0 TC.) If unity gain is adequate, (the signal voltage would be about 100 mV,) the two 10 K resistors can be omitted, and the gate of the 2N5484 tied directly to the output of the operational amplifier. Obviously, a 2SK3372 JFET would be a better choice for a cherry picked, (i.e., idss2 > idss1, for a specific microphone cartridge,) cascode transistor, but availability is an issue, (it is available, at Digi-Key, in a surface mount package-requiring soldering to 30 mil spaced leads, see 2SK33720RLCT-ND, for example.) Note that, like the microphone, purpose designed amplifiers for the WM61A are a fairly straight forward process-in this case, the microphone was designed for measuring near field distortion products of a Subwoofer Speaker Design at high SPLs in conjunction with Baudline. A Note About Operating Modes of the WM61AIn Figure I, the Panasonic WM61A microphone cartridge is biased with a Thevenin equivalent of a 1.1K resistor and a 2.5 Volt source. Usually, for amplification, JFETs are operated in the saturation region of their characteristic curves, where the source to drain voltage, vds, is greater than vpo + vgs, (and since the gate and source are connected, vgs = 0, meaning greater than vpo.) But note that vpo can be larger than 2.5 Volts, meaning that the transistor can be operated in the Ohmic region of its characteristic curves in a worst case analysis. For operation in the saturated region, (vds > vpo + vgs):
          id = idss * (1 - (vgs / vpo)^2)
             = idss * (1 - (2 * (vgs / vpo)) + (vgs / vpo)^2)
          did /dvgs = gm = idss * ((2 / vpo) + ((2 * vgs) / (vpo^2))

          vgs = 0

          gm = (2 * idss) / vpo
And the small signal gain, g, is:
g = rl * gm
For a typical gm of 1 / 1600 mhos, and an rl of 1100 Ohms, the typical gain is 0.6875. For operation in the Ohmic region, (vds < (vgs + vpo) / 4):
rds = (vpo^2) / ((2 * idss) * (vgs + vpo))
Where the on resistance of the JFET is rds, and rl and rds form a resistor divider-rds being a voltage, controlled, (by vgs,) resistor, (which, also, provides a way of measuring vpo of the JFET in the WM61A in Figure I.) To find the gain of the JFET when operated in its Ohmic region, assume the drain current, id, is provided by a constant current source, (perhaps through a sufficiently large load resistor, rl, that drives the device into its Ohmic region of operation,) developing a drain-source voltage, vds. The drain-source voltage, vds, would be:
          id * rds = vds = (id * vpo^2) / ((2 * idss) * (vgs + vpo))
          id * rds = vds = ((id * vpo^2) / ((2 * idss)) * (1 / (vgs + vpo))
          dvds / dvgs = ((id * vpo^2) / (2 * idss)) / ((vgs + vpo)^2)

          vgs = 0

          dvds / dvgs = g = id / (2 * idss)
In Figure I, the JFET transistor operates with an id that is near idss, so the gain is about 0.5, which compares favorably with the gain of the transistor operated in its saturated region of about 0.7. This is why the WM61A will operate over a large range of vpo, idss, and rl. 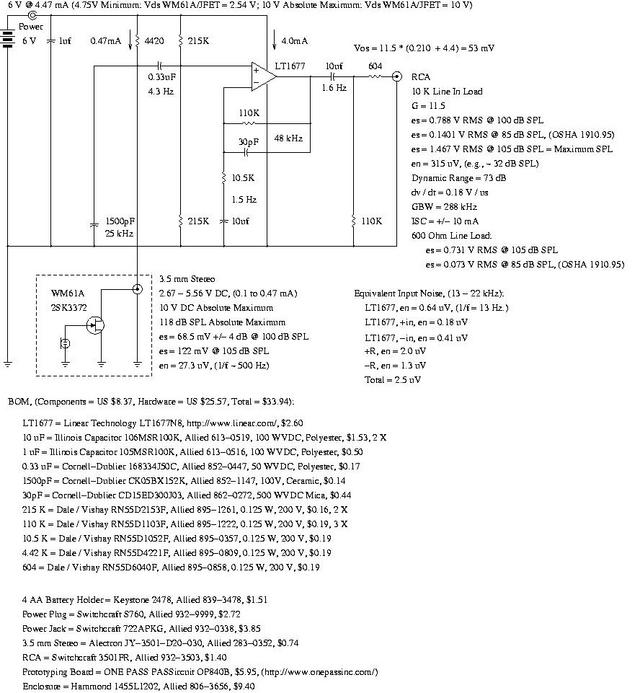 Figure XI. Self Biased Test Amplifier for the Panasonic WM61A Electret MicrophoneFigure XI, (which is available in larger size jpeg, or xfig, format,) is the schematic of a self biased test amplifier for the Panasonic WM61A Electret Microphone. This is a very versatile amplifier. For example, removing the 1500 pF capacitor, and replacing the 4420 Ohm resistor with a 120 K, will operate the WM61A's JFET in its Ohmic region, (guaranteed, worst case, over make at 25 C.) The difference between Ohmic and saturated operation, (this amplifier is guaranteed, worst case, over make at 25 C, to operate in the JFET's saturated region with a 4420 Ohm resistor,) can be tested by shunting the 120 K with the 4420 Ohm resistor. The 120 K resistor provides a nearly constant 50 uA current through the JFET which will have a gain, g, 0.05 <= g <=0.25, depending on the particular JFET's parameters, (about +/- 8 dB,) with about 200 mV nominal output at 118 dB SPL. The Notes and Asides: Section contains design and measurement details of the circuit in Figure XI. It is possible to analyze the distortion products when operating the WM61A with its JFET in saturated mode:
          id = idss * (1 - (vgs / vpo))^2
          id = idss * (1 - (2 * (vgs / vpo)) + ((vgs / vpo)^2))
          id = idss - (idss * (2 * (vgs / vpo))) + (idss * ((vgs / vpo)^2))
which has a DC term, (idss,) a linear term, (idss * (2 * (vgs / vpo))), and a second order term, (idss * ((vgs / vpo)^2)). The ratio of the second order term and the linear term is how much smaller the second order distortion is than the linear term. Letting vgs = A sin(wt), and vgs^2 = (A sin(wt))^2 = (A^2 / 2 ) * (1 - cos(2wt)), and dropping the DC terms, the ratio of the amplitude of the second order to the fundamental, D:
          D = (idss * ((A / vpo)^2 / 2)) / (idss * (2 * (A / vpo)))
          D = (A / vpo / 2)^2) / (2 * (A / vpo))
          D = ((A^2) / (vpo^2) / 2) / (2 * (A / vpo))
          D = A / (4 * vpo)
Which means for low distortion, A must be small, and/or, vpo must be as large as possible. For example, at 94 dB SPL, A is about 12.9 mV, and if vpo is 0.5 Volt, the second order distortion products would be a few thousandths of a percent; for measuring sound intensities below about 100 dB linearization would not be required. As a closing note, this section is about linearizing the WM61A microphone cartridge for digital signal processing of sound signals. This may not be desirable for all cases-for example, subtracting the linear gain, low pass filtering the remaining square law signal, and taking the square root of the filtered output will provide a root-mean-square indication of the sound level, (which is a requirement of OSHA 1910.95, for example, in sound level meters.) Evaluation of Panasonic WM61A Measurement Microphones:Seven of WM61A measurement microphones were chosen, at random, for evaluation-the cartridges may, or may not, have been from the same production run. The evaluation test set up consisted of two identical Linux PCs, each with an Ensonic/SoundBlaster CT4810 sound card. The first machine generated a 997 Hz., 0 dBFS signal from the Line out of the sound card, using Sox. The second machine ran Baudline and Xoscope to measure distortion and amplitude of the Line In of the sound card. The Line Out of the signal PC was connected to the Line In of the measurement PC, and the signals set to 0 dBFS on both PCs, via Aumix, by running Xoscope on both, simultaneously. The calibration Aumix setting for both was:
          vol:100
          pcm:62
          line:75
          igain:43
All other channels were set to zero. The Line In of the measuring PC was disconnected from the signal PC, and shorted to ground. The flat band noise level measured -115 dB, (and had a 1/f break frequency of about 2 kHz,) on Baudline as a reference. The breadboard amplifier above, operating the WM61A's JFET in saturated mode, and with no linearization, was then connected to the Line In of the measuring machine, (with no measurement microphone connected,) and there was no change in the flat band noise level, (or 1/f break frequency.) The seven measuring microphones under evaluation were then connected to the breadboard amplifier in succession, and the noise floor measured at -105 dB, (an increase of 10 dB, which is reasonable, the WM61A, specification claims greater than -97 dB,) and the 1/f break frequency increased to about 2 kHz. Each microphone was wrapped in the middle of a pillow for ambient sound damping. A Behringer UB 502 was connected to the Line Out of the signal PC, and adjusted such that it's Phones Out was 4.9 V RMS, as measured by an inexpensive RadioShack Model 22-807 multimeter. The 4.9 V RMS output was reduced to 13 mV through a resistor divider, and coupled via a 3 uF capacitor to the microphone input of the breadboard amplifier, (the output is connected to the measuring PC's Line In,) which is running Baudline, and the second harmonic, (2 * 997 = 1994 Hz.,) amplitude measured at approximately -100 dB, (the fundamental amplitude was 0 dB, corresponding to about 100 dB SPL.) The baseline of the measuring set up is now known. A set of Sennheiser HD 490 headphones was connected, through a resistor divider, to the Phones Out of the UB 502; the resistor divider was designed such that the impedance presented to the headphones was identical to the Sennheiser HD 490 headphone impedance, (32 Ohms,) and the signal at the HD 490 headphones was 0.5 V RMS. The Sennheiser HD 490 headphones were then generating 100 dB SPL. The seven measuring microphones under evaluation were then connected to the breadboard amplifier in succession, pressed into the HD 490's ear cushions, and the voltage at the output of the breadboard amplifier measured, and found to be 0.976 V RMS, +/- 1.09 dB, (which is reasonable, since the WM61A's specification is +/- 4 dB, worst case.) Also, the relative amplitude of the second harmonic of the 997 Hz., 100 dB SPL, test signal was measured by Baudline, (relative to the amplitude of the fundamental at 0 dB amplitude,) and found to be -60 dB, (0.1%,) with no significant change in any of the seven microphones. Note that the combined second harmonic distortion amplitude of the measurement microphone AND the Sennheiser HD 490 headphones, together, was about 0.1%, at 100 dB SPL. The measurement microphones were then moved approximately one inch from the ear cup of the HD 490, decreasing the sound level at the microphone cartridge by about -20 dB, and amplitude of the second harmonic distortion was measured at about -60 dB below the -20 dB fundamental, (i.e., about -80 dB,) meaning there was no difference in the ratio of the fundamental amplitude to the second order amplitude, when decreasing the fundamental sound level amplitude by an order of magnitude. This means that HD 490s were creating most of the 0.1% distortion, (which is impressive for any sound transducer operating at 100 dB SPL-the Sennheiser product line is noteworthy for low distortion.) However, all that can be claimed is that all seven of the WM61A measurement microphones exhibited less than 0.1% second harmonic distortion amplitudes at 997 Hz., 100 dB SPL sound intensity levels. Representative Screen Shots During the Analysis: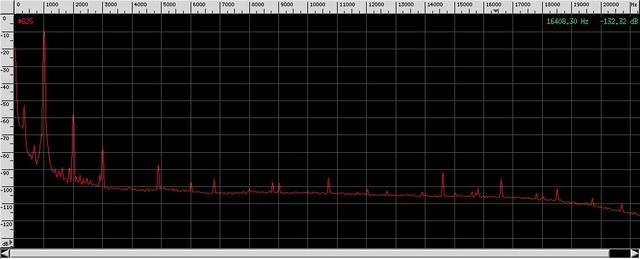 Figure XII. Measurement Microphone Using the Panasonic WM61A Electret Cartridge Spectrum Response to a 997 Hz., 100 dB SPL Sound LevelFigure XII is a measurement microphone using the Panasonic WM61A electret cartridge spectrum response to a 997 Hz., 100 dB SPL sound level. The microphone response portrayed is number 4, (the gold short one in the pictures, below,) and the analysis was made by Baudline's time averaged spectrum analysis. Note the flat band noise floor of about -105 dB / sqrt (hz.), (0 dB corresponds to 0 dB FS, which was calibrated to correspond to 100 dB SPL,) and the 1/f break frequency of about 2 kHz. Note, also, that the distortion levels include the entire measurement system-both sound cards, the UB 502, the Sennheiser HD 490s, and the breadboard amplifier, and the measurement microphone. (The additional noise around 2 kHz. and below was created by the keyboard space bar being pressed to stop the time averaging, which was picked up by the microphone under test-the actual value of the amplitude of the second harmonic is about -65 dB; reducing the frequency scale indicates that the magnitude of the fundamental is actually near 0 dB.) 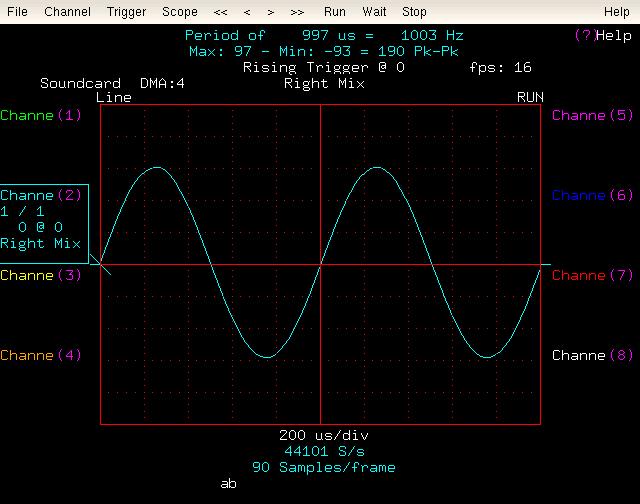 Figure XIII. Measurement Microphone Using the Panasonic WM61A Electret Cartridge Response to a 997 Hz., 100 dB SPL Sound LevelFigure XIII is a measurement microphone using the Panasonic WM61A electret cartridge response to a 997 Hz., 100 dB SPL sound level. The microphone response portrayed is number 4, (the gold short one in the pictures, below,) and the display was made by Xoscope. Note that the display is a graph of the internal registers of the sound card in the measuring machine, (and not the AC signal-these values are from output of the sound card's A/D converter.) A peak-to-peak of 193 corresponds to 0 dB FS on the Line In of the sound card, and reads 0.136 dB low. With a noise level of 62 dB below 94 dB SPL, (68 dB below 100 dB SPL,) and a distortion level nearing 0.5% at 100 dB SPL, the dynamic range of the WM61A is about 68 dB. Inexpensive PC sound cards have a noise level of about 75 dB below 0 dB FS, so the noise performance of the measurement microphone is on par with the PC sound system. By comparison, the self noise of the WM61A and a PC sound card is about equivalent to a quiet library room, 40 dB SPL. Expensive microphones used in recording studios, (which cost thousands of dollars,) exhibit 0.5% distortion at 130 dB SPL, and have dynamic ranges of about 110 dB. Recording studios typically have a 20 dB SPL ambient noise level-about the same level as professional microphones. Archive of Alternative Measurement Microphone Construction Design Worksheets Using the Panasonic WM61A:These measurement microphones are a collection built for special projects-they take from 15 minutes to an hour to build using only hand tools, all available from a home improvement center, (a cordless drill, drill bits, tubing cutter, and a tap and die for the more complicated microphones.) All can be many feet long, (although one foot is specified in the drawings.) 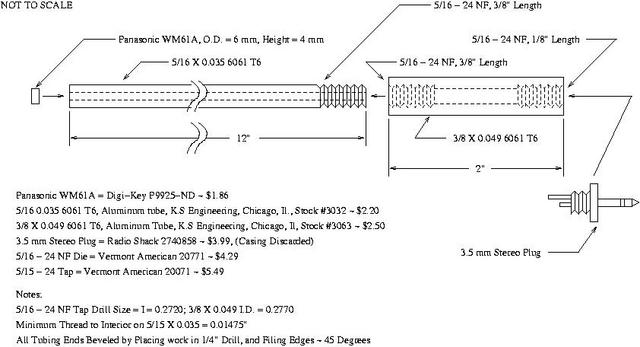 Figure XIV. Alternative Construction of a Measurement Microphone Using the Panasonic WM61A Electret CartridgeFigure XIV, (which is available in larger size jpeg, or xfig, format,) shows an alternative construction of a measurement microphone using the Panasonic WM61A electret cartridge. Note the requirement for cutting threads with a die-the aluminum is very thin, and this can be difficult to do without an alignment fixture. 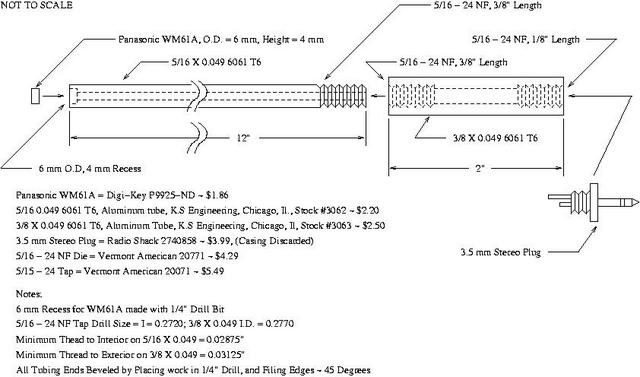 Figure XV. Alternative Construction of a Measurement Microphone Using the Panasonic WM61A Electret CartridgeFigure XV, (which is available in larger size jpeg, or xfig, format,) shows an alternative construction of a similar measurement microphone using the Panasonic WM61A electret cartridge. Note, also, the requirement for cutting threads with a die-the aluminum is very thin, and this can be difficult to do without an alignment fixture-although the aluminum is thicker than in the previous design. 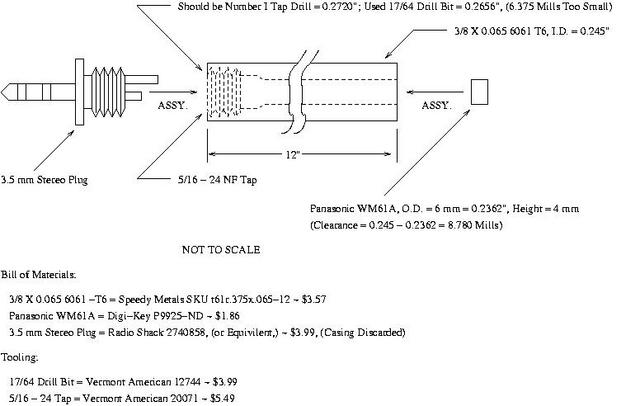 Figure XVI. Alternative Construction of a Measurement Microphone Using the Panasonic WM61A Electret CartridgeFigure XVI, (which is available in larger size jpeg, or xfig, format,) shows an alternative construction of a measurement microphone using the Panasonic WM61A electret cartridge. Note only a tap is required-making construction far simpler. This is the simplest design for a measurement microphone with an extension. However, assembling two solder joints on a 1/8 inch plug, and getting it into a quarter inch tube can be difficult-the alternative is to use the strain relief from a Radio Shack 3.5 mm stereo plug, 2740858, (the one discarded, above,) and screw it into the end of the tube, (it fits fine,) after running cable from a 3.5 mm stereo extension cable through the tube, and to the electret cartridge. (I prefer plugs on the microphone casing so when someone trips on a cable, it pulls the plug out instead of pulling the mic crashing down-but plugs are about 20% of on-site problems, so its a trade off.) If durability is not an issue, the tap can be omitted, and heat shrink tubing, (or electrical tape,) can be used to implement a strain relief. Assembly Photographs of Measurement Microphone Construction Using the Panasonic WM61A:As always, assembly requires safety considerations, like safety glasses, etc. ElectricalElectrical assembly photographs of a measurement microphone using a 3.5 mm stereo plug, (probably the easiest to build,) as a case-with some notes. 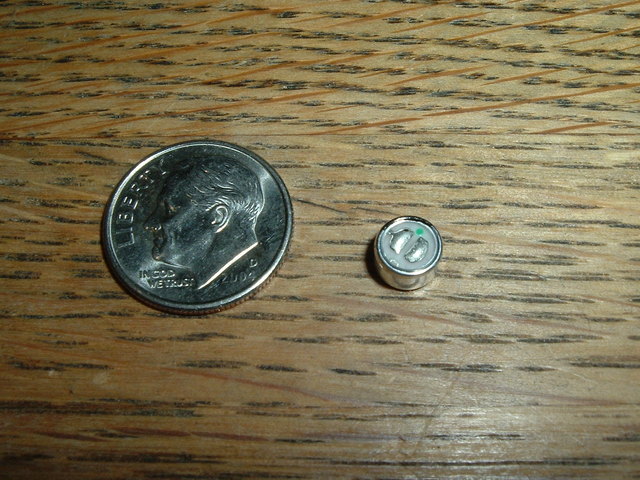 Figure XVII. The Panasonic WM61A Electret Cartridge and a DimeFigure XVII shows the small size of the Panasonic WM61A electret cartridge. Note the small tab in the center of the top contact pad of the elecret case-that's the ground pin; the other pin, at the bottom of the cartridge, is the drain of the JFET amplifier. 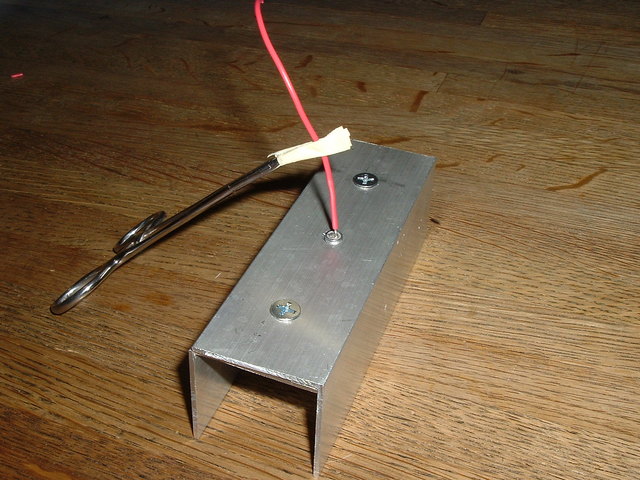 Figure XVIII. The Panasonic WM61A Electret Cartridge and Soldering FixtureFigure XVIII shows the soldering fixture for the Panasonic WM61A electret cartridge. It is quite difficult to solder wires on the cartridge without a fixture. Apparently, the cartridge was designed to be assembled into a system using reflow solder techniques, (the advantage of reflow soldering is that it is a self aligning process; exact alignment of the wires is not required, the surface tension of the solder will center the wires when it melts, provided there is enough flux on the solder joint.) The fixture does the same thing-the wire is tinned, cut to about 1/32 inch stripped length, flux applied to the end of the wire, flux applied to the electret cartridge contact pad, (with a tooth pick,) the wire placed on the cartridge contact pad, then stabilized with a pair of hemostats, (with masking tape to preserve wire insulation from the teeth on the hemostat,) and the joint touched with a soldering iron, (I used a 33 Watt, with a 1/8 inch conical point,) for about a second, (one can see the hemostats drop about 1/64 inch, and the wire center itself, when the solder melts.) The cartridge is then rotated 180 degrees, and the other wire soldered on the same way. The fixture is two pieces of scrap aluminum angle, (from a house project-available at any home improvement center,) as shown, with a 1/4 inch hole for the cartridge in the top piece, and two screws to hold the two pieces together. It takes about 15 seconds to complete the solder connections to the cartridge. Note that there is an alternative to soldering the wires: use a 1/32 inch double sided PC board, approximately a quarter of an inch in height, with tabs for soldering to the electret cartridge that have runs extending back, down the board, to a larger area for soldering wire or connector plug terminals-which can be reflow soldered, too. 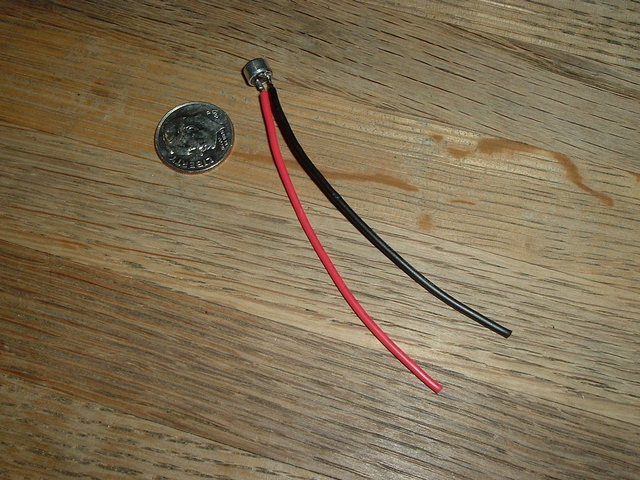 Figure XIX. The Panasonic WM61A Electret Cartridge With Leads AttachedFigure XIX shows the Panasonic WM61A electret cartridge with leads attached. These are relatively secure-pulling the wires will pull the contact pad off the cartridge before the solder breaks. The wire is 22 gauge, stranded, 80C, 1/64 PVC, 300 V, Radio Shack 278-1224, (three spools of different colors per package, $6.49.) 24 gauge would be preferred, but was unavailable. 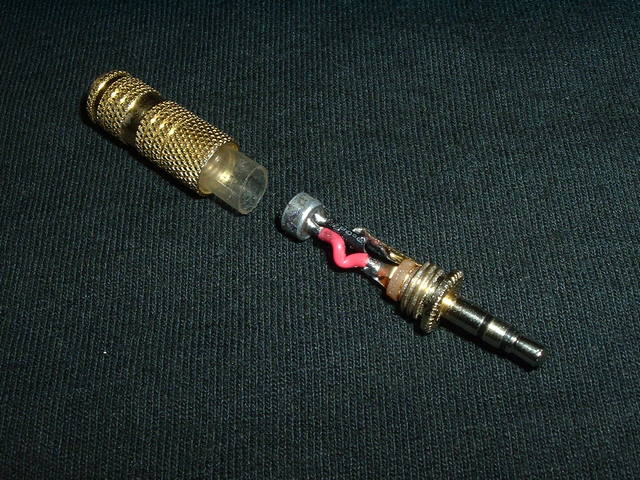 Figure XX. The Panasonic WM61A Electret Cartridge and HousingFigure XX shows the Panasonic WM61A electret cartridge prior to assembly in the 3.5 mm stereo plug. The fit should be verified-the black cloth on the electret cartridge should be flush with the rear surface of the 3.5 mm stereo plug when inserted, and screwed down finger tight-pinch the wires to fit. Then, disassemble, cover the diameter/sides of the electret cartridge with silicon sealant, (I use GE's Silicon II, Household Glue-which is available in the paint department of home improvement centers,) taking care to not get any on the black cloth on the cartridge, and the cartridge/plug screwed into place-the cartridge/case seal should be air tight. 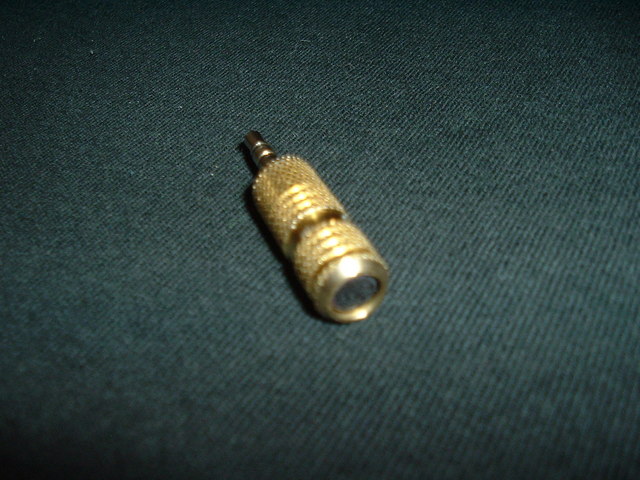 Figure XXI. The Finshed Measurement Microphone Using the Panasonic WM61A Electret CartridgeFigure XXI shows the finished microphone using the Panasonic WM61A electret cartridge. The measurement microphone can be plugged directly into the 3.5 mm Mic input of a PC sound card, (or through a PC Mic/Sound standard cable.) The microphone works well as a lapel clip on with Skype, producing about 65 dB SPL, (the sound level of standard speech at 1 meter-depending on sound card, alignment, settings, etc., which is the defacto standard for telephone handsets, too,) in the receiver's earphones. The WM61A has the highest gain of the series, (by 10-20 dB,) but is omni-directional, which may be an advantage or disadvantage, depending on application. 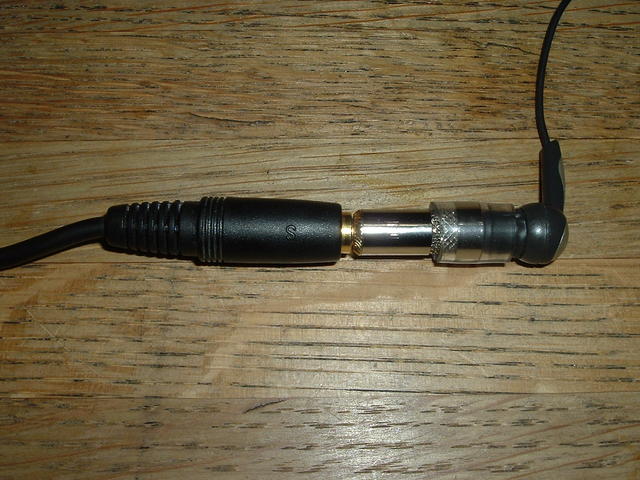 Figure XXII. Calibrating the Measurement Microphone Using the Panasonic WM61A Electret CartridgeFigure XXII shows the finished microphone using the Panasonic WM61A electret cartridge being calibrated. For commercial applications, use professional microphones calibrated at a licensed laboratory, for litigation/compliance reasons. A reasonable calibration for casual uses can be made by starting with a calibrated Linux system, (for example, see Linux Sound System Calibration,) and using an earbud, (Sony MDR-EX51LP is shown,) as the reference transducer to generate a known sound level-manufacturers specify the voltage necessary to produce a given SPL, (which seems to be within about 5 dB-good enough for some casual purposes.) On one Linux PC, use Sox to generate an 85 dB SPL = -15 dB FS, 997 Hz. signal to the earbud:
          sox -w -s -t .nul /dev/zero -t ossdsp /dev/dsp \
              synth 3600 sine create 997 vol 0.177827941
This is a standard alignment signal, (as per EBU R68-2000, and, EBU R89-1997.) With the microphone connected to the Mic of the sound card on a second Linux PC, use Xoscope to set the sound level of the mixer program, (Aumix, for example,) for -15 dB FS. The second PC can be used with that specific measurement microphone to measure SPL. The earbud is connected to the measurement microphone, (a WM61A installed in an inexpensive Neutrik NY8231G 3.5 mm stereo plug is shown,) via a piece of 3/8 inch neoprene tubing, (available from any hardware store.) The tubing should fit air tight between the earbud and microphone, (this is why the electret cartridge was installed in the 3.5 mm stereo plug air tight with silicon sealant.) As a side bar, if you use earbuds and have trouble with the fit, (i.e., the bass goes away,) you can measure measure the phenomena with this set up; use Baudline as a white noise generator, (which measures the response to all frequencies at once,) and look at the FFT, while wiggling the earbud in the test set up-when it gets lose, the bass goes away, (the fit is really quite critical.) Note in the photograph there are wrinkles on the earbud seal-this should be avoided, (it will actually whistle at high SPLs as the air escapes.) Note, also, that increasing the distance between the earbud and measuring microphone to about one inch, (using longer neoprene tubing,) will approximate the human ear canal, giving a "bump" in the frequency response at about 5 kHz., which is quite visible in Baudline.  Figure XXIII. Measurement Microphones Used in Distortion AnalysisFigure XXIII shows four of the seven measurement microphones used in the distortion analysis. The second order distortion was less than 0.1% at 100 dB SPL for all seven microphones. Amplifier Figure XXIV. Breadboard of Amplifier Used in Distortion AnalysisFigure XXIV shows the breadboard of the amplifier, above, used in the second order distortion analysis. The amplifier operated the WM61A's JFET in its saturated region, and no linearization was used for the measurements.  Figure XXV. Final Assembly of Amplifier Used in Distortion AnalysisFigure XXV shows the final assembly of the amplifier, above, used in the second order distortion analysis. Mechanical Figure XXVI. Alignment Fixture for Drilling/Reaming TubingFigure XXVI shows the alignment fixture for drilling/reaming tubing or 3.5 mm plugs. A safe way to drill/ream the hole in the end of the 3.5 mm plug to 1/4 inch for the 6 mm diameter Panasonic WM61A electret cartridge. The fixture is a piece of scrap wood, with a 3/8 inch hole perpendicular near the middle, then cut-grain wise-through the hole to make a piece part clamp. The piece part should be mounted perpendicular to the bench for sighting while drilling, with the drill bubble level, (if the drill has one,) in the center; both axis are then under visual control while drilling. Note that most of the above procedure(s) are mechanized as much as possible. I usually make about half a dozen measuring microphones at once, (it takes about half an hour,) because they roll off and hide, get stepped on, etc., so the process has to be reliable-few, or no, failures/rejects, and the microphones have to be inexpensive, (less than US $5 each.) Note that the above procedure actually uses a "kit" to produce the microphones, kept in a plastic bag, complete with the tooling. Using the Panasonic WM61A as a Measurement Microphone to Measure Room Response:
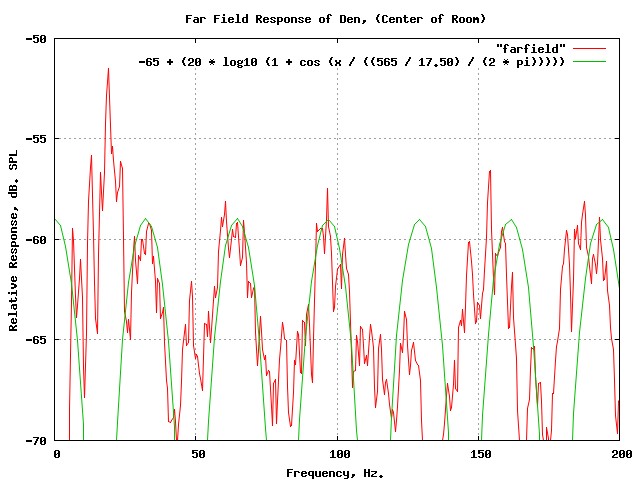
Figure XXVII. Room Response Using the WM61A as a Measurement MicrophoneFigure XXVII is a plot of the frequency response of a typical room using the WM61A as a measurement microphone. The room size is 17.50' X 13.17' X 7.83', and the microphone was placed in the exact center of the room on all axis, and the sound source on one wall of the long dimension of the room. The sound source was a KLH Model 17 acoustic suspension speaker, (and simple low power monophonic amplifier,) driven by the whiteLF_sound(1) program from the sine_sound.tar.gz archive to linearize the response of the KLH speaker at low frequencies with the following commands:
          p 5.3
          g 0.006
          a 20.0
which provided a flat white noise sound signal from the speaker for the analysis of room acoustical characteristics. (White noise contains equal amplitudes of all frequencies, and Baudline can average the the response over several minutes to provide smoothed data-its a convenient technique that filters out non-noise spurious signals, like like sound from passing cars, etc.) As an intuitive development, using the function-sum trigonometric identity, for a single sound source, (speaker,) producing an incident sound wave on a microphone, and a single reflective wall behind the microphone, (reflecting 100% of the sound back at the microphone,) and summing the incident and reflected sound waves at the microphone:
          sin (A) + sin (B) = 2 * sin ((A + B) / 2)
                                * cos ((A - B) / 2)

              A = w * t
              B = w * (t - d)

          sin (w * t) + sin (w * (t - d)) =
              2 * sin (((w * t) + (w * (t - d)) / 2))
                * cos (((w * t) - (w * (t - d))) / 2)

          sin (w * t) + sin (w * (t - d)) =
              2 * sin ((((w * t) + (w * t) - (w * d)) / 2))
                * cos ((((w * t) - (w * t) - (w * d)) / 2))

          sin (w * t) + sin (w * (t - d)) =
              2 * sin ((w * t) - ((w * d) / 2))
                * cos ((w * d) / 2)

          sin (w * t) + sin (w * (t - d)) =
              2 * sin (w * (t - (d / 2))) * cos ((w * d) / 2)
where 'd' is the time delay of the sound wave from the microphone, to the wall, and back to the microphone, and the sound source is sin (wt). Note that the sound pressure at the microphone is twice amplitude of the sound source, and delayed by 'd / 2', and, is multiplied by a cosine function with arguments of frequency and distance; this is the standing wave envelope. Note that at various combinations of frequency and distance, the sound pressure at the microphone will be zero, (called a node, where the cosine function is zero,) and at others, twice the amplitude of the sound source, (called an anti-node, where the cosine function is unity.) Since there are six walls, (with sound waves being reflected between opposite pairs of walls,) the intuitive acoustic model for the room is:
          -65 + (20 * log10 (1 +
              (cos (x / ((565 / 17.50) / pi))) *
              (cos (x / ((565 / 13.17) / pi))) *
              (cos (x / ((565 / 7.83) / pi)))))
Which is quite sensitive to the accuracy of the room parameters, (to the point of being unstable,) and can be approximated as:
          -65 + (20 * log10 (1 +
              (cos (x / ((565 / 17.50) / (2 * pi))))))
The room response graph uses the longest room dimension to provide the response of the major, (lowest,) room resonant anti-node, (peak,) frequencies. The room's ambient noise floor was about -68 dB, (32 dB SPL.) The data was taken with the excellent Baudline, (and, a logarithmic modification-to align to the logarithmic relative response of the graph was used, above.) The intuitive arguments are in reasonable agreement with the theoretical development from Room Acoustics, which is a very commendable treatise on the subject.
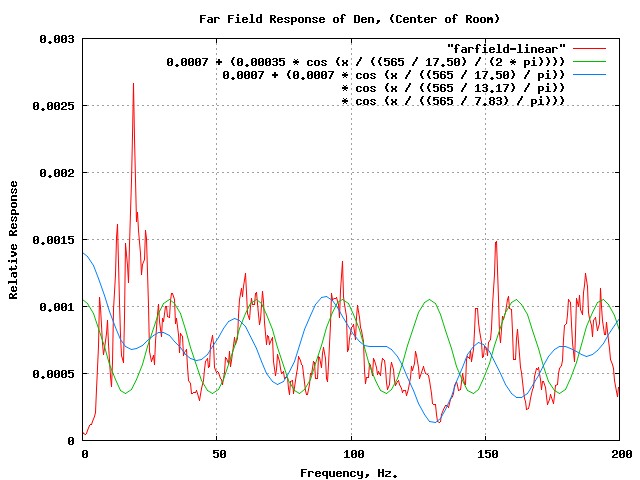
Figure XXVIII. Linear Room Response Using the WM61A as a Measurement MicrophoneFigure XXVIII is a linear plot of the graph in Figure XXVII, overlayed with the intuitively developed equations with "guestimate" parameters. The vertical axis has been exponentiated to show the value of the cosine envelope of the standing waves in the room. The average sound pressure level in the the room is 0.000781, (corresponding to 0.0344 Pascal.) The graph shows the sound level to have dropped into the ambient noise level of the room-about 32 dB SPL at the nodes. The data in the graph was used to specify speaker parameters for the room, (which is quite "live," with wood floors, wood paneling, brick fireplace, and a lot of glass.) Note that speaker response down to 20 Hz. is undesirable for a flat response in this room, (it would be characterized as "boomy,") and a speaker with a -3 dB. low frequency cutoff of about 35 Hz. was used to provide a low frequency "flat" room response down to about 20 Hz. Note that equalizing the room response is not feasible, and even if it was, would only be valid for one point-in the exact center of the room; and makes the Case For Stereo Headphones, particularly with a Spatial Distortion Reduction Headphone Amplifier. However, if speakers are mandatory, a near field Studio Monitor configuration is recommended-and works well on computer desks, (the amplitude of the "ripples" due to the room's standing waves is proportional to the distance from the speakers to the listener.) Using the Panasonic WM61A as a Measurement Microphone to Measure Headphone Response:Headphones, (and earphones/earbuds,) are designed to contour frequencies-they are not designed to deliver a flat frequency response. Headphone designers use an anthropomorphic heads for development, (for example, see the Head Measurement System from Head Acoustics,) which are expensive. For non-critical headphone response measurement, a simple plastic ear canal will suffice for response measurement using the WM61A as a measurement microphone for the ear drum. The response of the plastic ear canal should look similar to Figure 14 of the PDF file, The Artificial Ear Dilemma: The challenges of modern handset testing. Note that the Fletcher Munson equal-loudness contours are, approximately, the inverse of the ear canal contours, since ear canal resonance(s) dominate the frequency characteristics of the human hearing. The human ear canal is about 26 mm = 1.02 inches long and about 7 mm = 0.276 inches in diameter, (although there is about a 20-50% variability in the two numbers across populations.) The closest vinyl tubing, (available at local home improvement stores for about $0.50 US per foot,) is 1/4" ID, which will be used for the plastic ear canal. For the pinna, (the outer part of the ear,) a simple board will be used. Astonishingly, this simple anthropomorphic ear yields reasonable results in non-critical applications.  Figure XXIX. The Plastic Ear CanalFigure XXIX shows the plastic ear canal, and is made from a 21/32" length of 1/4" ID X 3/8" OD vinyl tubing inside of a 2 1/2" length of 3/8" ID X 1/2" OD vinyl tubing, and recessed 1/4" for the external entrance to the ear canal-the microphone, (which serves as the ear drum,) is slid tightly against the short piece of tubing from the other end. The recess of the small tube is altered to set the resonant frequency of the ear canal to 3500 Hz., (using Baudline.) All pieces should fit near air tight.
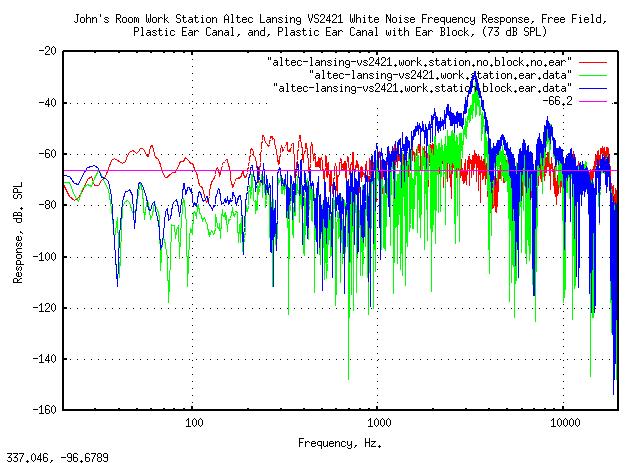
Figure XXX. Frequency Response of the Plastic Ear Canal Using the WM61A as a Measurement MicrophoneFigure XXX shows the frequency response of the plastic ear canal using the WM61A as a measurement microphone. The response is similar to Figure 14 of the PDF file, The Artificial Ear Dilemma: The challenges of modern handset testing, but has a slightly sharper resonance. Again, white noise (which contains equal amplitudes of all frequencies,) was used as a signal source, and Baudline averaged the plastic ear canal response over several minutes to provide smoothed data. A PC sound system, (running Linux,) was used as the signal source, (the white_sound(1) program from the sine_sound.tar.gz archive was used to generate the white noise,) with, and without, the plastic ear canal, (also, with, and without, the board functioning as the pinna.) The linear response without the plastic ear canal was then, point-by-point, subtracted from the linear response of the plastic ear canal-a rather complicated way of reducing the effects of the PC speaker response from the response of the plastic ear canal, (and accounts for the roughness of the curves.)  Figure XXXI. Headphone Response Measurement Using the WM61A as a Measurement MicrophoneFigure XXXI shows the headphone response measurement using the WM61A as a measurement microphone for a set of Sennheiser RS130 headphones. The board functioning as the pinna is a scrap piece of wood with a 1/2" hole in the middle-the plastic ear canal is inserted through the hole, (tightly,) and is flush with the back side of the board.
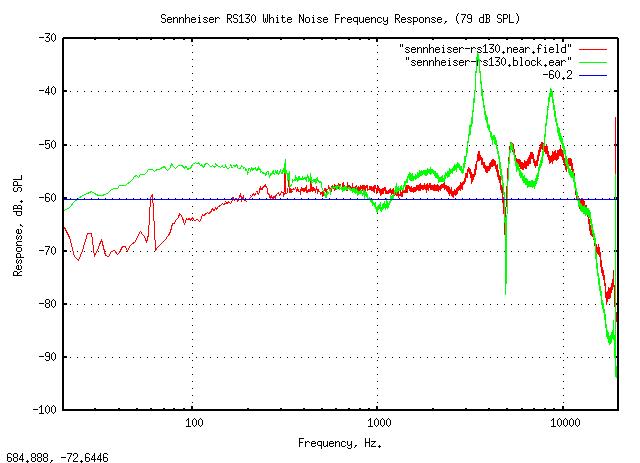
Figure XXXII. Response of the Sennheiser RS130 Using the Plastic Ear Canal and the WM61A as a Measurement MicrophoneFigure XXXII shows the response of the Sennheiser RS130 using the plastic ear canal and the WM61A as a measurement microphone. The near field measurement was made by placing the microphone about 1/16" from the driver element of the headset, (without the plastic ear canal.) The "block.ear" graph is the sound pressure level, (SPL,) at the "ear drum" of the plastic ear canal, and is similar to Figure 14 of the PDF file, The Artificial Ear Dilemma: The challenges of modern handset testing.
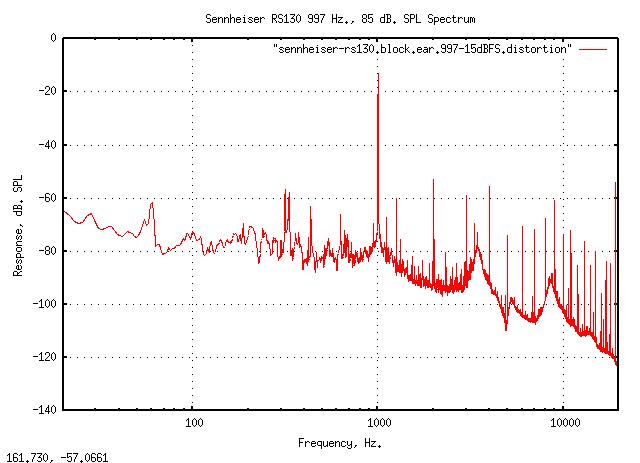
Figure XXXIII. Spectrum of the Sennheiser RS130 Using the Plastic Ear Canal and the WM61A as a Measurement MicrophoneFigure XXXIII shows the spectrum of the Sennheiser RS130 using the plastic ear canal and the WM61A as a measurement microphone. It is the headphone response to an 85 dB SPL, 997 Hz. signal, (provided by the sine_sound(1) program from the sine_sound.tar.gz archive.) The second harmonic is down about 40 dB, corresponding to about 1% distortion.  Figure XXXIV. Earbud Response Measurement Using the WM61A as a Measurement MicrophoneFigure XXXIV shows the earbud response measurement using the WM61A as a measurement microphone for a set of Sony MDR-EX51LP earbuds. (Both the earbud and microphone should be in contact with the inner vinyl tube, and provide a near air tight seal-although the picture, incorrectly, shows a slight gap due to movement for camera lighting.)
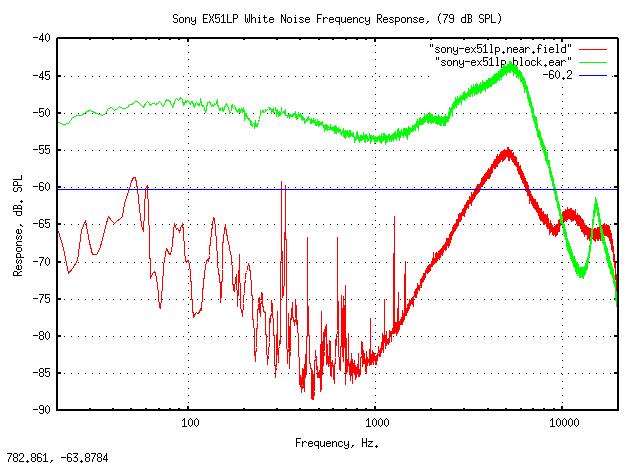
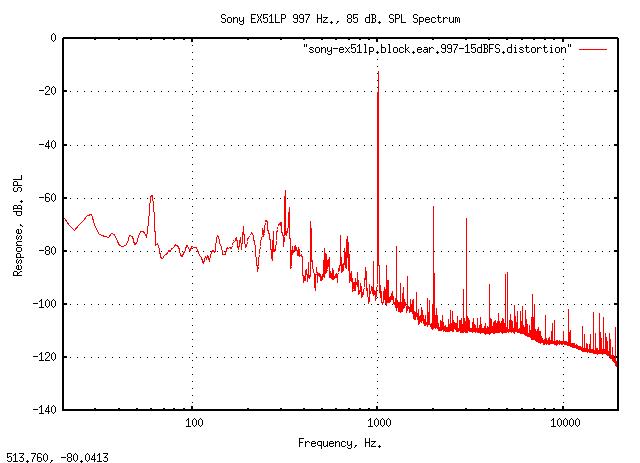
Figure XXXV. Response of the Sony MDR-EX51LP Using the Plastic Ear Canal and the WM61A as a Measurement MicrophoneFigure XXXV shows the response of the Sony MDR-EX51LP using the plastic ear canal and the WM61A as a measurement microphone. The near field measurement was made by placing the microphone about 1/16" from the driver element of the seal of the earbud, (without the plastic ear canal.) The "block.ear" graph is the sound pressure level, (SPL,) at the "ear drum" of the plastic ear canal. There are issues with many inexpensive earbuds-the length of the ear canal is shortened by inserting an intra-ear earbud, and, the exterior canal opening sealed, creating an unnatural frequency contour at the ear drum. See Linkwitz Lab's Reference Earphones for possible solutions. Note that the plastic ear canal inside diameter is smaller than the median of the population, (7 mm = 0.276 inches, and the plastic ear canal has an inside diameter of 0.25".) The frequency response of the human ear canal is quite sensitive to its dimensions. A note of caution for people with small ear canals, (i.e., those that use the small silicon seals with the earbuds.) The sound level pressure on the ear drum increases with decreasing ear canal diameter-in this case, about 10 dB above the manufacturer's specification, and decreasing the volume level would be advisable. To demonstrate, the plastic ear canal was changed to a single piece of vinyl tubing, about 2" long, 3/8" ID X 1/2" OD, (3/8" = 0.375", which is larger than the median population,) with an ear canal length of 1", (for a resonant frequency of 3.3 kHz.):
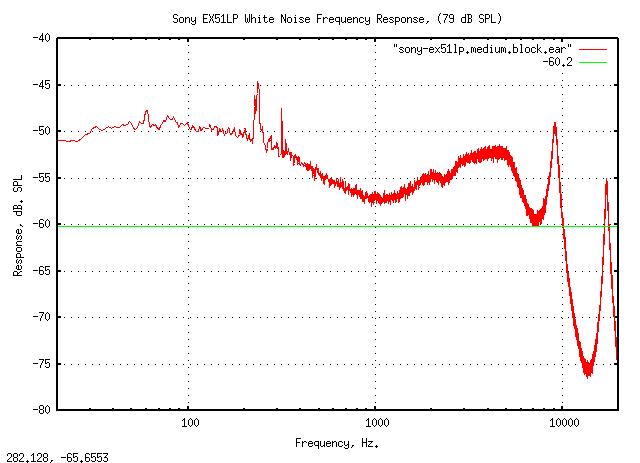
Figure XXXVI. Response of the Sony MDR-EX51LP Using the Large Plastic Ear Canal and the WM61A as a Measurement MicrophoneFigure XXXVI shows the response of the Sony MDR-EX51LP using the large, (3/8" ID X 1/2" OD, 1" length,) plastic ear canal and the WM61A as a measurement microphone. Note the difference in frequency response of increasing the inside diameter of the plastic ear canal by 50%, which is well within the population distribution. The frequency response of the Sony MDR-EX51LP using the large, (3/8" ID X 1/2" OD, 1" length,) plastic ear canal creates a relatively natural frequency contour at the ear drum-but this depends on the dimensions of a specific person's ear canal. It is possible to test a set of earbuds for compatibility-simply plot the minimum level that is detectable at frequencies, (say, every 200 Hz. from 500 Hz. to 10 kHz.,) by generating a sine signal, (the sine_sound(1) program from the sine_sound.tar.gz archive will do, and, so will sox(1),) and varying the amplitude, (i.e., varying the volume control on aumix(1) will work,) and plot the minimum detectable level that can be heard as a function of frequency, (its called a sensitivity test, and is a standard way of testing such things.) There should not be any deviation, (say, of more than +/- 5 dB,) from the Fletcher Munson equal-loudness contours threshold. Alternatively, there is an online test available at Equal loudness contours and audiometry.
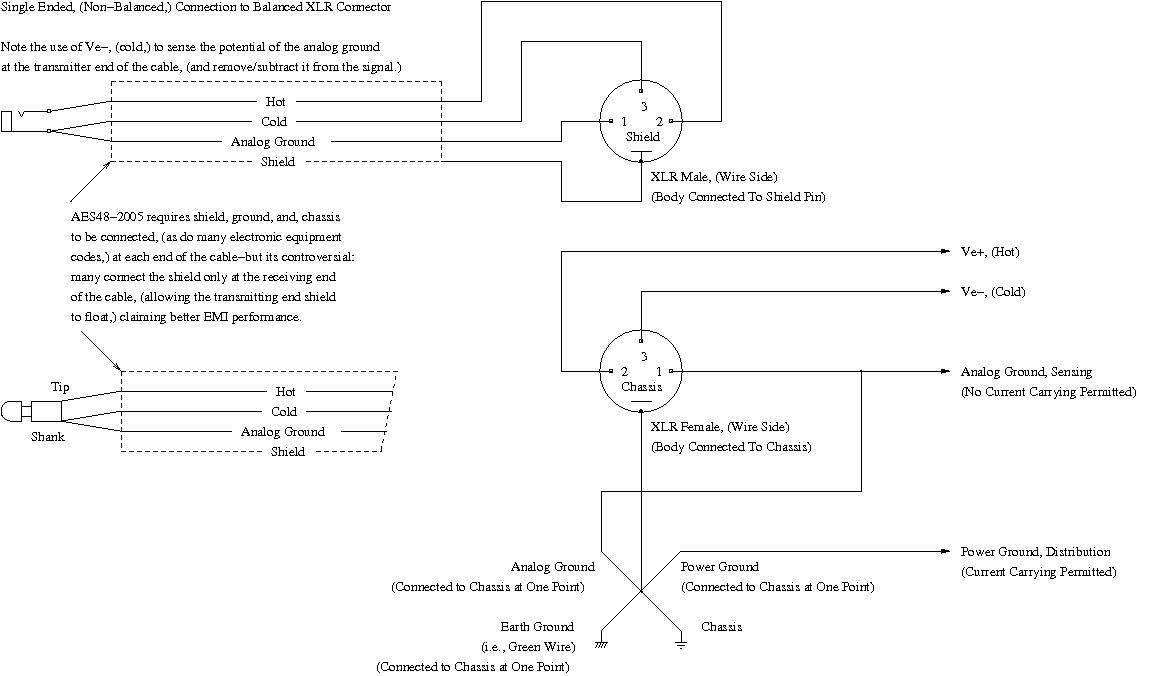
Figure XXXVII. Spectrum of the Sony MDR-EX51LP Using the Plastic Ear Canal and the WM61A as a Measurement MicrophoneFigure XXXVII shows the spectrum of the Sony MDR-EX51LP using the plastic ear canal and the WM61A as a measurement microphone. It is the earbud response to an 85 dB SPL, 997 Hz. signal, (provided by the sine_sound(1) program from the sine_sound.tar.gz archive.) The second harmonic is down about 40 dB, corresponding to about 1% distortion. As a concluding remark, the most important test in evaluating headphones is not power handling capability, it is the opposite-the minimum level, (in SPL,) that is detectable as a function of frequency. A calibrated sound source is required, (a PC with a sine wave generator program, and calibrated volume control, or sensitive volt meter,) and a graph made of the the minimum detectable level as a function of frequency. (The test requires a very quiet room, and what one is doing is similar to an audiology test.) The resulting graph should be almost identical to the Fletcher Munson equal-loudness contours. There is a significant difference in the dimensions of the ear canal across populations, (and thus frequency response,) but ideally, the graph should be near the Fletcher Munson equal-loudness contours. Music played through headphones where this is true is balanced as the mixer console sound engineers intended, when played back at a sound level of about 85 dB SPL, in accordance with EBU R68-2000, EBU R89-1997, and, SMPTE RP 155, which define the relevant program level recording industry standards, (and, OSHA 1910.95 compliant, too.) Other interfaces for the Panasonic WM61A:The WM61A is quite adaptable, and other interface alternatives exist: 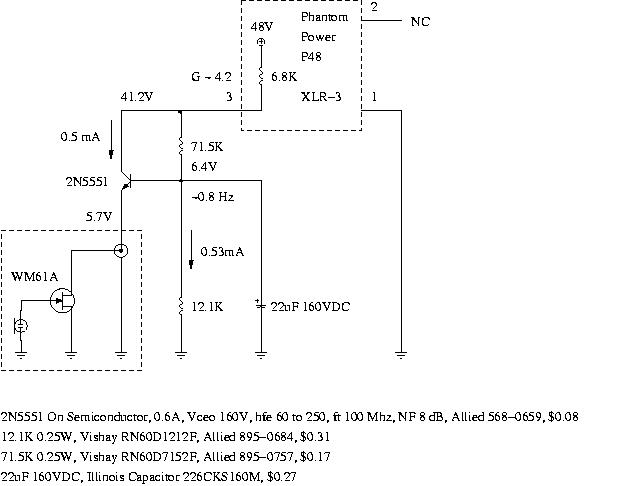 Figure XXXVIII. Phantom Powering the WM61A Electret MicrophoneFigure XXXVIII, (which is available in jpeg, or xfig, format,) shows a simple unbalanced interface for the Panasonic WM61A Electret Microphone to the 48 Volt, (IEC 61938 P48,) phantom power supplied by many mixer consoles to professional condenser microphones. The 2N5551 NPN transistor is operated in cascode common base mode and has a 140 Volt Vceo, (about a safety factor of 3,) and requires only 3 other passive components, (all with at least a safety factor of 3.) The capacitor is probably not required for tight layouts, but since the amplifier has a bandwidth of approximately 100 MHz., high frequency parasitic oscillation is a concern; replacing the 12.1 KOhm resistor with a 6 V Zener diode and a small ceramic capacitor is yet a better alternative. Note that the circuit is single ended unbalanced, so not much should be expected in stray pickup rejection of the cabling, etc., although balanced circuit configurations do exist: 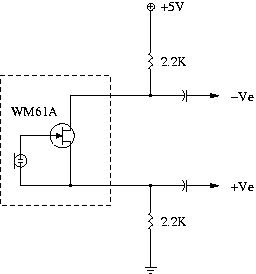 Figure XXXVIX. Balanced Interface for the WM61A Electret MicrophoneFigure XXXVIX, (which is available in jpeg, or xfig, format,) shows a simplified schematic for a balanced interface to the Panasonic WM61A. Notice that the microphone case must be insulated from ground, and that both resistors are effectively driven by current sources, (i.e., infinite impedance-the positive signal is not produced as a source follower,) so the output impedance would be about 2.2 KOhms in each leg, (e.g., total output impedance = 4.4 KOhms,) and require buffering to match standard 600 Ohm cabling for a complete schematic. A differential amplifier, (which can be DC coupled after the resistors are merged,) would complete the schematic. Near Field Speaker Configuration:Recording and broadcast studios usually have an enclosed control room with a mixing console for controlling/balancing the levels of various microphone inputs used in a session. Many audio engineers prefer balancing the various levels in the output feed using headphones. Others prefer speakers to eliminate headphone super stereo effect, which could affect the color of the output feed. A favorite technique, used by those preferring speakers, of monitoring a session with flat frequency response in the control room is the near field speaker configuration. Usually, near field monitoring is done at 85-90 dB SPL, where the Fletcher Munson equal-loudness contours are approximately flat, (i.e., this is the sound level intended for use by the end listener, and is OSHA 1910.95 compliant.) The monitor speakers are located very close to the mixing engineers ears, (usually, less than two feet,) and the volume set low, such that at that distance, the sound level is 85 dB SPL, (i.e., an average program level of about a quarter Watt per speaker, with peaks 15-20 dB above this level, or a 50 Watt peak total, 25 Watt peak per channel amplifier would be quite adequate for compliance with EBU R68-2000, EBU R89-1997, and, SMPTE RP 155, which define the relevant program level recording industry standards.) The speaker of choice is a sealed box, (i.e., acoustic suspension book shelf speaker,) that has a critically damped low frequency contour. The low frequency cutoff of the speaker should be near 565 divided by the control room's longest dimension, in feet, (i.e., the low frequency cutoff is used to control the peaking of the control room's first fundamental resonance.) If necessary, any additional frequency contouring is done at 6 dB per octave, using simple single pole/zero, (i.e., single R/C, scenario,) contouring, since the speaker is critically damped. Many sound engineers consider near field monitoring as the
the best configuration available, (particularly for music.) To
show why it produces a flatter frequency response, consider a
room with two stereo speakers mounted on the wall, equal
distance from each other, and each equal distant to the
listener, (i.e., standard stereo configuration.) If the
distance from the listener to the wall with the speakers is
Of interest is the similarity of using a PC with gaming speakers in much the same manner-i.e., the speakers setting close to the listener, (on each side of the computer terminal, perhaps with a woofer on the floor,) with reduced volume to provide a flatter frequency response for music listening, etc.
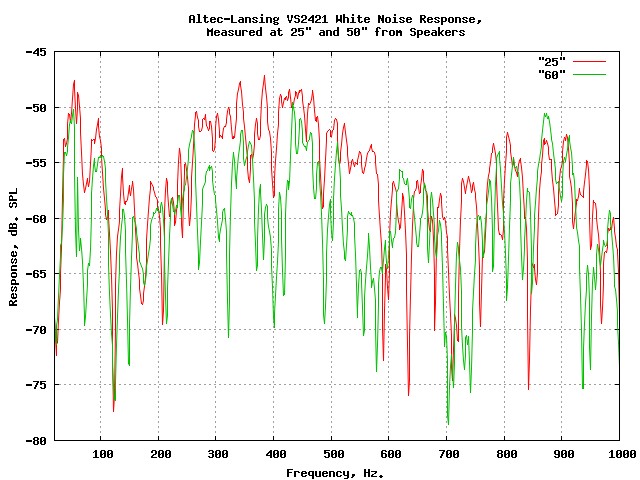
Figure XXXX. Near and Far Field Speaker ConfigurationFigure XXXX shows a comparison of near and far field speaker configuration for an Altec Lansing VS2421 PC/Gaming speaker set. For the near field graph, (red,) the speakers were 29 inches apart, (angled in 30 degrees,) and the Panasonic WM61A microphone was mounted 29 inches from each satellite speaker, at 43 inches from the floor. For the far field graph, (green,) the microphone was moved 60 inches from the speakers, (half way to the rear wall-the room is 11' X 11' X 8', a relatively live sounding office, with a fundamental resonance at about 51 Hz.,) at 48 inches from the floor, in the exact middle of the room. Of interest is the drop in average sound level between the two graphs, (it should be about 6 dB, since the distance was about doubled from the satellite speakers to the microphone,) and the reduction in the peak-to-peak standing wave amplitude artifacts for the near field, (for example, the range between 250 and 600 Hz.,) which should be halved, or about 6 dB less. A note about the measurements. The exact average sound pressure level as a function of frequency for the near field, (red,) measurement should be -57 dB SPL, and -63 dB SPL for the far field, (green.) The increased level in the near field around 250 to 600 Hz. (averaging about 3 dB.,) is created by the interaction between the ports, (the VS2421's satellite speakers are ported to extend low frequency response,) and the microphone-the sound dispersion to the sides from the ports is minimal at 29 inches. A sealed/acoustic suspension enclosure would be a better choice, albeit at a substantial price increase, and larger size/desk foot print. The VS2421 specification lists the low frequency cutoff, (-10 dB.,) at 35 Hz., which reduces the peak response of the fundamental resonance of the room, (51 Hz.,) substantially, (which is why this particular speaker set was chosen for this room.) Notes and Asides:The design criteria for the circuit in Figure XI is as follows:
The sound card noise of 76 dB below 0 dBFS is typical for commodity PC sound cards. Note that the dynamic range, of 68 dB, is limited by the microphone self noise, and defining 100 dB SPL to be 0 dBFS. A quiet library is 40 dB SPL, which is 8 dB above the noise level of the microphone, which is a factor of 6.3 larger sound intensity than the microphone self noise; note that the microphone would only add 10 * log (1 + (1 / 6.3)) = 0.64 dB to the noise level of a quiet library. Defining 0 dBFS to be 108 dB SPL, (by reducing the gain of the amplifier in Figure XI by 8 dB,) results in a dynamic range of 76 dB, limited by the noise level of the PC sound card. The definition of 0 dBFS to be 100-108 dB SPL corresponds to the following industry standards:
Since 0 dBFS is 100-108 dB SPL, the program level is about 85-90 dB SPL, consistent with OSHA 1910-95. It is also the preferred level for mixing by recording engineers since the Fletcher Munson equal-loudness contours are approximately flat, (i.e., this is the sound level intended for use by the end listener for proper balance between bass and treble frequencies in recorded music.) 108 dB SPL corresponds to a microphone distortion of approximately 1%, and is consistent with other analysis, (for example, Testing Panasonic's WM-61A Mike Cartridge.) 1% distortion is regarded as the maximum sound pressure level for a microphone. Note that the microphone amplifier in Figure XI is designed to measure industry standard sound intensities in typical recording/playback environments, with background noise approximately equal to a quiet library.
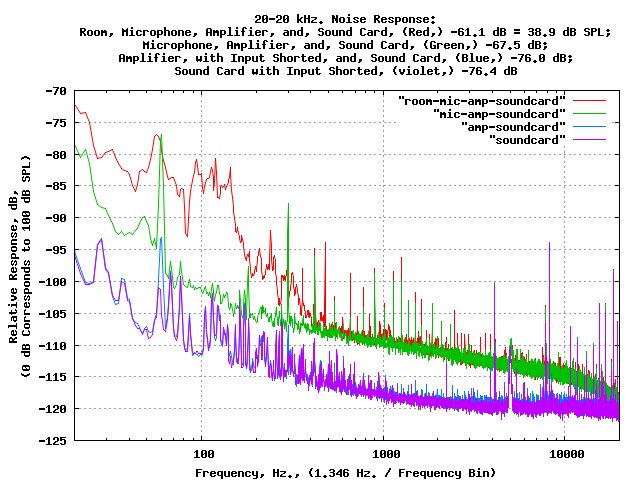
Figure XXXXI. Noise Performance of the WM61A Electret MicrophoneFigure XXXXI shows the noise performance of the Panasonic WM61A using Baudline, (with a Transform size of 32768.) The bottom line, (Purple,) is the spectral density of the PC sound card noise, (i.e., with the Line In inputs shorted to ground,) and measures -76.4 dB below 0 dBFS, (0 dBFS corresponds to 100 dB SPL.) The next line, (Blue,) is the spectral density of the PC sound card noise with the amplifier in Figure XI attached to the Line In of the sound card, and the microphone input of the amplifier grounded; note that the amplifier contribution to the overall noise level is insignificant, (about 0.4 dB.) The next line, (Green,) is with the microphone attached to the amplifier and PC sound card. To produce a low noise environment to measure microphone self noise, the microphone was suspended, (via the cord,) in an empty quart glass wine bottle-using the cork to secure the cord-with the bottle wrapped in a fluffy pillow, and placed in an insulated beverage cooler setting on a fluffy pillow, on a bed, with doors and windows closed in the room. Sound damping materials are ineffective at low frequencies, (below several hundred Hz.,) and the mass law must be used to provide a quiet acoustic environment. The noise level is dominated by the microphone self noise level and is 67.5 dB below 0 dBFS, (corresponding to 32.5 dB SPL at 0 dB = 100 dB SPL.) The last line, (Red,) is the microphone/amplifier/sound card measuring the noise in same room and location at about 61.1 below 0 dBFS, (corresponding to 38.9 dB SPL, or about the same as a quiet library.) Note the 1/f^2 low frequency response of the room due to the mass law, and is typical of all structures, (which is why recording studios prefer buildings with concrete construction-which moves the 1/f^2 frequency response to the left.)
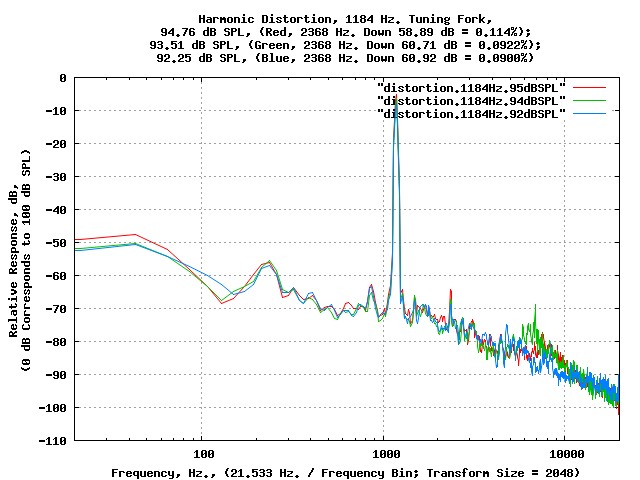
Figure XXXXII. Distortion Products of the WM61A Electret MicrophoneFigure XXXXII shows the harmonic distortion products of the Panasonic WM61A. A tuning fork was used to produce a very low distortion acoustic sine wave by striking the fork, and moving the fork in very close proximity to the test microphone, (and demonstrating keyboard competency with clearing Baudline's Average function, and freezing the display when the tuning fork amplitude decayed to between 90 and 100 dB SPL.) The harmonic distortion products of the Panasonic WM61A, amplifier in Figure XI, PC sound card, (and tuning fork,) is about 0.1% at 94 dB SPL.
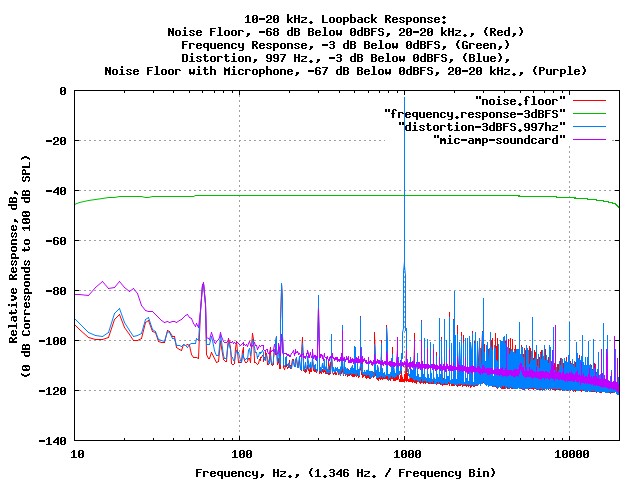
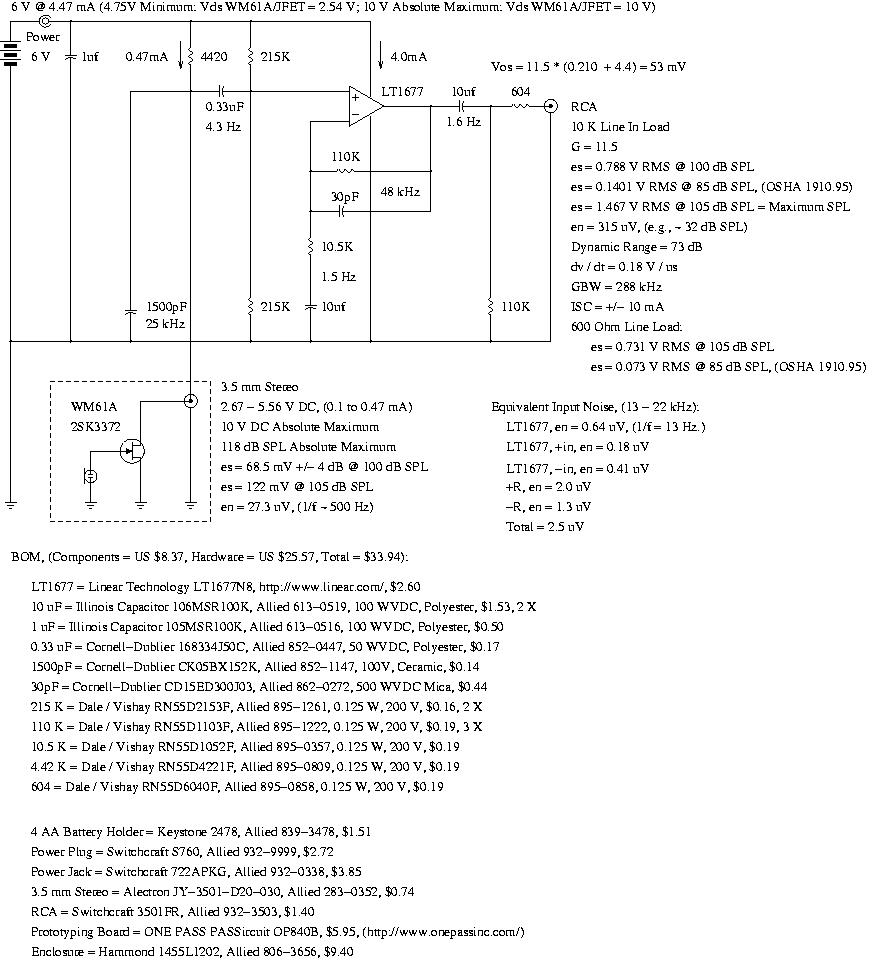
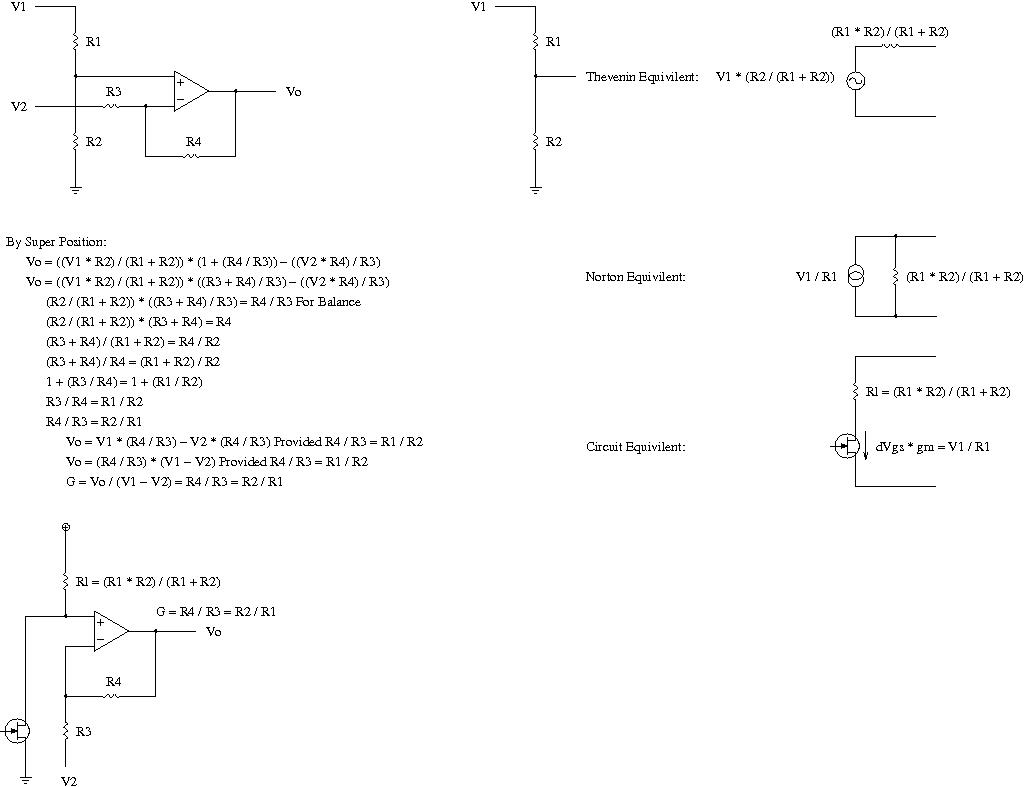
Figure XXXXIII. Loopback ResponseFigure XXXXIII shows the loopback response of microphone electronics in the intended measurement system, which consists of the PC sound card's Line Out used to produce a 997 Hz., 0 dBFS, reference sine signal, which drives one channel of a Behringer UB502 mixer, which drives the device under test, (DUT, presumably an audio sound system, perhaps a speaker system, as measured by the microphone,) and the microphone amplifier is connected to a Behringer UB1002 mixer which is connected to the PC sound card's Line In. The PC runs various analytical programs on the microphone output, (perhaps Baudline or Xoscope.) It is important to verify that the microphone, (dynamic range, distortion, and noise floor,) and the PC sound card, (noise floor,) are the limiting devices in the "quality" of the loopback chain. The second harmonic distortion of the loopback chain electronics is about -80.29 dB, (the signal was -2.90 below 0dBFS, or 0.0134% distortion, which was obtained by replacing the microphone with a 270K resistor with large electrolytic coupling capacitor.) The -3dB points of the loopback system below -41.97 dB at 997 kHz. is about 11 Hz., and, 18 kHz, (obtained with Baudline's sweep facility.) The microphone noise level from Figure XXXXI, (Green line,) is superimposed on the loopback chain response to indicate the dominant noise source in the loopback chain-the microphone. However, if the 0 dBFS is changed from 100 dB SPL to 108 dB SPL, the PC sound card becomes the dominant noise source in the loopback chain, (100 dB SPL = 0 dBFS was chosen to simplify testing procedures-and is adjustable via the gain settings of the Behringer UB1002.) If a PC sound card is not used, (or is not the limiting noise source,) the Panasonic WM61A dynamic range can be extended an order of magnitude using the circuit in Figure VIII:  Figure XXXXIV. Large Dynamic Range WM61A Electret Microphone AmplifierFigure XXXXIV, (which is available in larger size jpeg, or xfig, format,) is the schematic of a large dynamic range amplifier for the Panasonic WM61A Electret Microphone. This amplifier was purpose designed around the "typical" values for the 2N5484 and WM61A, (and may not be suitable for manufacturing due to manufacturing parametric distributions.) The microphone exhibits less than 1% distortion at 127 dB SPL, (obtained with a tuning fork calibration at 95 dB SPL-about the maximum sound pressure level available from a tuning fork-to calibrate speaker distortion at SPL dB SPL at one meter, and then using a near field measurment for higher sound pressure levels for the microphone,) and has a dynamic range of 92.3 dB, (i.e., the noise floor is 92.3 dB below 127 dB SPL.) Although not an elegant design, (it depends on the very low noise characteristics of the Linear Technology LT1677 operational amplifier,) it is quite flexible and adaptable. The WM61A's frequency response extends well beyond 20 kHz., and has been used to record wildlife sounds, for example bat sonar. At the other end of the spectrum, the WM61A's low frequency response extends below 2 Hz., and has been used to record the spectrum of turbulence on an air foil. Note that with the exception of the output coupling capacitor, the microphone is DC coupled. 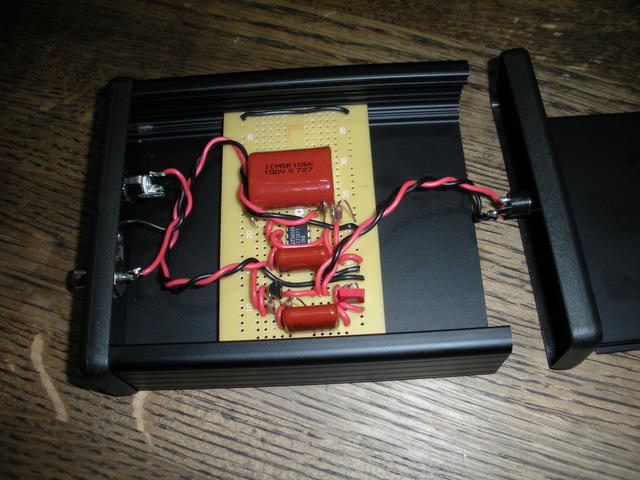 Figure XXXXV. Final Assembly of the Large Dynamic Range WM61A Electret Microphone AmplifierFigure XXXXV shows the final assembly of the large dynamic range WM61A amplifier. As always, with large dynamic range microphones, cabling issues can be problematical. Ideally, the amplifier should be physically located in the microphone housing, but such techniques require access to specialized assembly facilities. A balanced output, (using an inverting operational amplifier, DRV134/DRV135, SSM2142, etc.,) would be recommended, but would almost inevitably require a complicated bias network and/or bipolar power supply. A suitable alternative is custom built cables as used in the recording/broadcast industry for live off site recording sessions: 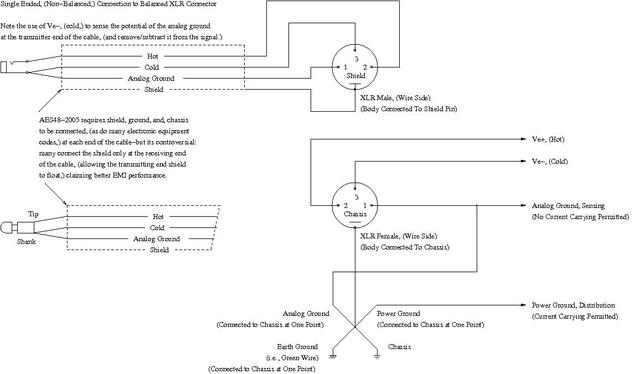 Figure XXXXVI. Special Cable Connections for EMI ReductionFigure XXXXVI, (which is available in larger size jpeg, or xfig, format,) shows special cable connections for EMI reduction when connecting the output of the microphone amplifier to a console. It is possible to convert the input circuit of the large dynamic range microphone amplifier from single ended to balanced: 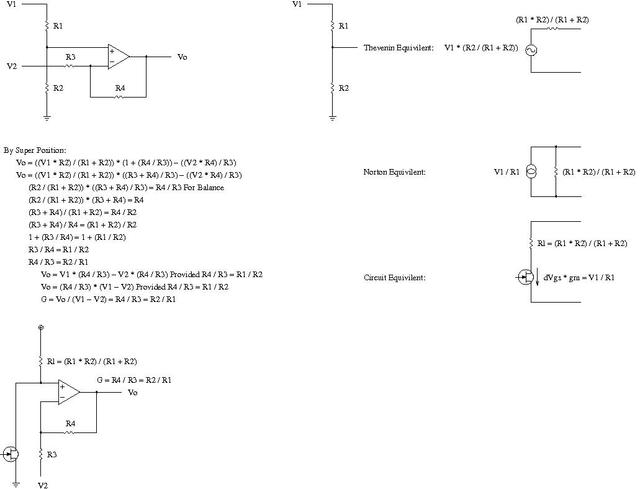 Figure XXXXVII. Balanced Input Amplifier Reductions/CalculationsFigure XXXXVII, (which is available in larger size jpeg, or xfig, format,) shows the balanced input amplifier reductions/calculations for the large dynamic range microphone amplifier. Again, this modification would probably necessitate a bipolar power supply. Effect of Driving Impedance on Headphone Frequency Response:Ear drum pressure headphone frequency response should not be linear-far from it. The ear is a single open ended tuned cavity, (created by the ear canal,) and the headphone frequency response should duplicate the ear drum pressure characteristics of listening through the open ended tuned cavity without the headphones. Figure 14 in The Artificial Ear Dilemma: The challenges of modern handset testing presents the typical pressure frequency response of a human ear. But note that there are considerable differences in the ear parameters across a population, (by about a factor of 2X,) and female/male differences, (see Figure 13 in The Artificial Ear Dilemma: The challenges of modern handset testing,) and even significant left-right ear differences, (see Figure 8 in The Artificial Ear Dilemma: The challenges of modern handset testing.) Headsets are designed around ear parameters of a typical human ear, and tested on anthropomorphic manikins, (as per The Artificial Ear Dilemma: The challenges of modern handset testing.) A controversial issue is the driving impedance for the headset, (e.g., the output impedance of the amplifier driving the headset.) To gain insight, three headsets will be evaluated: 1) an open air, (providing minimal ambient noise reduction, but allowing the listener to hear near by conversation); 2) circumaural, (providing substantial ambient noise reduction, through tight fitting ear cups); and, 3) an ear bud, (providing moderate ambient noise reduction, but small enough for portable electronics.) Each will be tested with a:
The signal for the headset under evaluation is provided by a 25 Watt audio power amplifier, with a 120 Ohm resistor connected between the output of the amplifier and headset. This provides a 120 Ohm source impedance to the headset. For a 1 Ohm source impedance, the headset is simply shunted with a 1 Ohm resistor, (and the signal amplitude increased to the same value used for the 120 Ohm source impedance measurement at the peak of the frequency response curve.) Since motional reactance of the headsets could, conceivably interfere with the measurements, the test setup in Figure XXXI and Figure XXXIV was used to support the measurement microphone. The Baudline FFT time-frequency browser designed for scientific visualization of the spectral domain was used to generate a sweep signal, (20-20kHz.,) and analyze the time averaged frequency response of each headset.
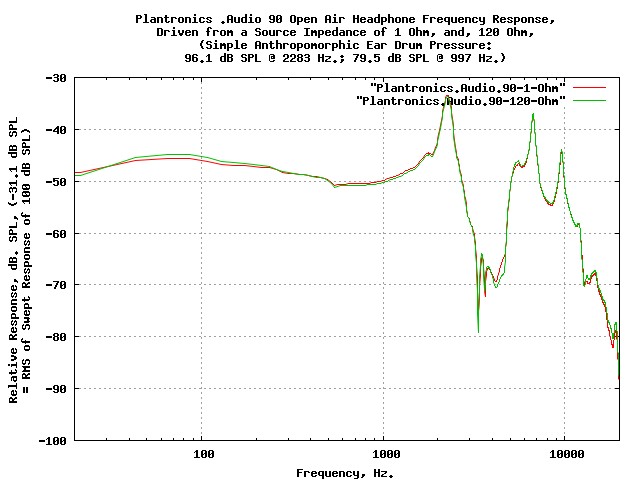
Figure XXXXVIII. Plantronics .Audio 90 Open Air Headphone Frequency ResponseFigure XXXXVIII shows the frequency response of the Plantronics .Audio 90 open air headphone using a 1 Ohm source driving impedance and 120 Ohm source driving impedance. Although the difference in frequency response is measurable, it is not audible.
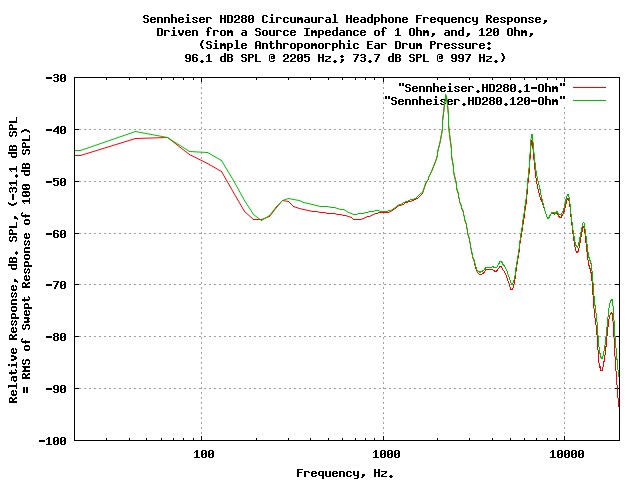
Figure XXXXVIV. Sennheiser HD280 Circumaural Headphone Frequency ResponseFigure XXXXVIV shows the frequency response of the Sennheiser HD280 circumaural headphone using a 1 Ohm source driving impedance and 120 Ohm source driving impedance. Although the difference in frequency response is measurable, it is not audible.
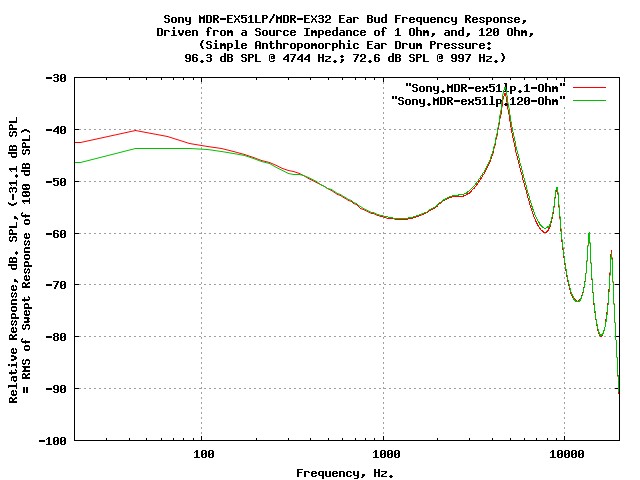
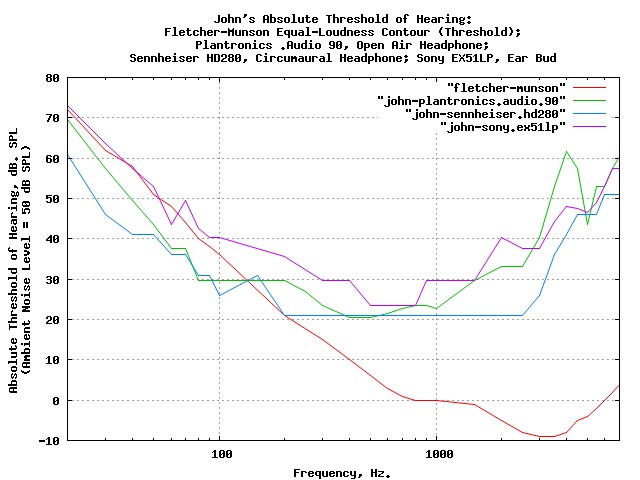
Figure XXXXIX. MDR-EX51LP/MDR-EX32 Ear Bud Frequency ResponseFigure XXXXIX shows the frequency response of the Sony MDR-EX51LP/MDR-EX32 ear bud headset using a 1 Ohm source driving impedance and 120 Ohm source driving impedance. The difference in frequency response is apparent only below about 80 Hz., and is 3.8 dB at 20 Hz. This would be audible in a single tone A-B comparison test, but the "colorization" of music, although audible, would be difficult to discern, statistically, due to the population differences in the human ear canal. Note the frequency position of the peaks and valleys in the MDR-EX51LP/MDR-EX32 ear bud headset plot. Ear buds are extremely sensitive to ear canal dimensions, (both ends of the ear canal tuned cavity are closed,) and the simple anthropomorphic ear canal is not adequate for precision measurements. Note that the compatibility of a headset with your ear canal parameters can be measured. It will take a very quiet room, (the loft a library, for example, or better yet a recording studio or audiologist's sound chamber,) and a PC running a sine wave generation program, (for example, Sox(1),) and measure the sound level of the absolute threshold of hearing as a function of frequency. The graph should be as close to the bottom line, (threshold,) of the Fletcher Munson equal-loudness contours as possible. For example, the absolute threshold of hearing for the Plantronics .Audio 90 open air headphones, Sennheiser HD280 circumaural, and, Sony MDR-EX51LP/MDR-EX32 ear buds, and my ears:
Figure XXXXX. Absolute Threshold of HearingFigure XXXXX shows the absolute threshold of hearing for Plantronics .Audio 90 open air headphones, Sennheiser HD280 circumaural headphones, and, Sony MDR-EX51LP/MDR-EX32 ear buds, and my ears, overlayed on the threshold of the Fletcher Munson equal-loudness contours. All headsets produce exactly 85 dB SPL at exactly 997 Hz., (standard alignment, manufacturer's specification,) which would have an absolute threshold of hearing of 0 dB SPL, (if it was not for the 20 dB SPL of ambient noise leaking into the headset, which is the lower limit of meaningful data in the test setup.) Also, +/- 5 dB accuracy on detection of the threshold at any frequency is considered good, (the very low frequencies are particularly difficult.) Since the headsets were aligned for 85 dB SPL at 997 Hz., the headset graphs can be legitimately moved up and down to obtain best alignment with the threshold of the Fletcher Munson equal-loudness contours. Note that all headsets follow the threshold contour fairly well in the low frequencies. Further, note that my ears do not follow the threshold of the Fletcher Munson equal-loudness contours at higher frequencies. The absolute threshold of hearing changes with age, and I am well beyond any age in the graphs on that page. Note that all that was done is use the standard audiometry threshold test, (which is encouraged for everyone, periodically,) to verify that a set of headphones will produce sound faithfully with your ear parameters. LicenseA license is hereby granted to reproduce this design for personal, non-commercial use. THIS DESIGN IS PROVIDED "AS IS". THE AUTHOR PROVIDES NO WARRANTIES WHATSOEVER, EXPRESSED OR IMPLIED, INCLUDING WARRANTIES OF MERCHANTABILITY, TITLE, OR FITNESS FOR ANY PARTICULAR PURPOSE. THE AUTHOR DOES NOT WARRANT THAT USE OF THIS DESIGN DOES NOT INFRINGE THE INTELLECTUAL PROPERTY RIGHTS OF ANY THIRD PARTY IN ANY COUNTRY. So there. Copyright © 1992-2010, John Conover, All Rights Reserved. Comments and/or problem reports should be addressed to:
|
Home | John | Connie | Publications | Software | Correspondence | NtropiX | NdustriX | NformatiX | NdeX | Thanks