|
From: John Conover <john@email.johncon.com>
Subject: Group of banks sue WorldCom. - Jul. 13, 2002
Date: Sat, 13 Jul 2002 12:55:26 -0700
Companies are complex systems. There are at least seven different methods currently used in the financial industry to valuate companies. All, like accounting principles, are heuristic benchmarks, i.e., based on intuitive arguments-as opposed to an axiomatic, formal science. All are based on the paradigm of Walrasian general equilibrium, (which was discounted by Debreu, Sonnenschein and Mantel-DSM-in the early 1970's,) and depend on the concept of the past being a useful indicator for predicting the future, i.e., a low entropy system.
The prevailing wisdom is that crooks in the executive suites, (and their accountants,) manipulating their company's valuation benchmarks, are the cause of the recent demise in the US equity market performance, (and everyone's 401-K.) But there has always been crooks in the executive suites of US businesses. (Additionally, people do not buy equities based on past or current valuations-they buy stocks based on speculation about their future value.)
So, can crooks in the executive suites of businesses manipulate valuations and create a market crash?
Fortunately, we can get a pretty good idea-the DJIA in the Twentieth Century was dominated by two events; the largest run down of the index in its history during the crash of 1929, and the largest run up in its history through the 1990s-and, we can compare the characteristics of both against the overall to see if there is any difference.
The historical time series of the DJIA's 28029 daily closes, from
January 2, 1900 through June 28, 2002, inclusive, was obtained from Yahoo!'s database of equity Historical Prices, (ticker symbol
^DJI,) in csv format. The csv format was
converted to a Unix database format using the csv2tsinvest
program, filename
djia1900-2002.
Using the methodology outlined in Quantitative Analysis of Non-Linear High Entropy Economic Systems, and converting the DJIA's time series from a log-normal distribution of the increments to a simple Brownian motion/random walk equivalent, where record 16376 corresponds to March 9, 1956, (the day the Brownian motion/random walk equivalent of the DJIA passed through its median = mean value, for the first time since the start of the crash of 1929):
    tsmath -l djia1900-2002 > djia.1900.01.02-2002.06.28
    head - 16376 djia1900-2002 | tsmath -l > djia.1900.01.02-1956.03.09
    tail - 11653 djia1900-2002 | tsmath -l | tsnumber -s 16376 > djia.1956.03.09-2002.06.28

    tslsq -p djia.1900.01.02-2002.06.28
    3.511896 + 0.000165t
    tslsq -p djia.1900.01.02-1956.03.09
    4.097496 + 0.000084t
    tslsq -p djia.1956.03.09-2002.06.28
    1.837033 + 0.000246t
|
|
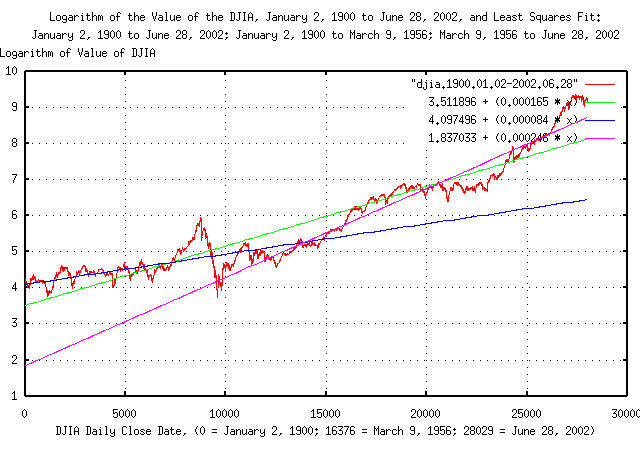
Figure I is a plot of the DJIA's Brownian motion/random walk equivalent, and the Kalman filtered least squares best fit for January 2, 1900 through June 28, 2002; January 2, 1900 through March 9, 1956; and March 9, 1956 through June 6, 2002.
The interpretation of Figure I is that, measured over the Twentieth
Century, the gain in the DJIA's value averaged a factor of
e^0.000165 = 1.00016501361 per
day. Where the value of the DJIA's Brownian motion/random walk
equivalent is above 3.511896 + (0.000165 *
t), the index is larger than its median = mean value,
(a postive bubble,) below, less than its median = mean value,
(a negative bubble,)and a negative slope indicates the index
is contracting.
Note that difference in growth, per day, of the last half of the
Twentieth Century, (since March 9, 1956,) compared with the Century as
a whole is e^0.000246 / e^0.000165 =
1.00008100328-hardly significant, (e.g., about 0.008%
per day.)
|
As a side bar, note that if someone was making a projection
on March 9, 1956, of the value of the DJIA for June 6, 2002,
based on data from January 2, 1900 through March 9, 1956, the
projected value would be about Granted, the market crash of 1929 was a very unusual event, indeed; (see Example I of Quantitative Analysis of Non-Linear High Entropy Economic Systems III for particulars,) but it does illustrate the need for meticulous detail when doing regression studies on high entropy systems, (apparently, 50 years of daily data is inadequate for making a 50 year projection-but that will be revisited later.) Additionally, if the value of the DJIA's Brownian
motion/random walk equivalent is above |
So, our conclusion so far is that the shenanigans in executive suites really didn't create anything of significance in the growth figures of the DJIA. A look at the durations of the expansions and contractions of the DJIA would be in order:
    tsmath -l djia1900-2002 | tslsq -o | tsrunlength | cut -f7 >\
        djia.1900.01.02-2002.06.28.runlength
    head -16377 djia1900-2002 | tsmath -l | tslsq -o | tsrunlength | cut -f7 >\
        djia.1900.01.02-1956.03.09.runlength
    tail -11653 djia1900-2002 | tsmath -l | tslsq -o | tsrunlength | cut -f7 >\
        djia.1956.03.09-2002.06.28.runlength
|
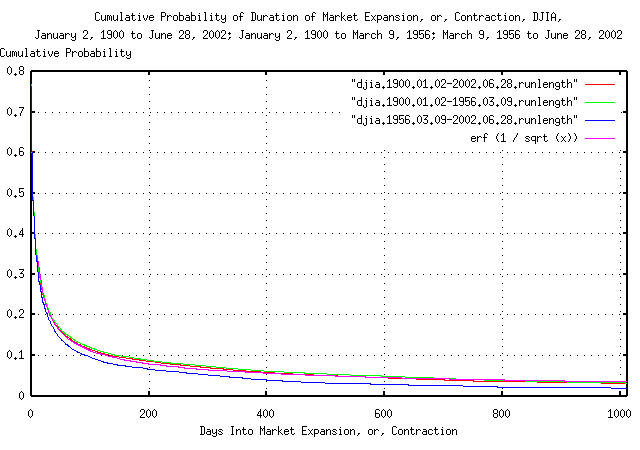
Figure II is a plot of cumulative probability of durations of
expansions and contractions of the DJIA's Brownian motion/random walk
equivalent for January 2, 1900 through June 28, 2002; January 2, 1900
through March 9, 1956; and March 9, 1956 through June 6, 2002; and its
theoretical value, erf (1 / sqrt
(t)).
The interpretation of Figure II is that, measured over the
Twentieth Century, the chances of an expansion or contraction in the
DJIA lasting at least 200 trading days, (about nine and a half
calendar months,) for example, is a little less than 0.1
= 10%.
|
As a side bar, the shape of the graphs in Figure II are very
close to For The bubble of the 1990's lasted about 8 years, or
about 2024 trading days. What are the chances of that happening?
Another important number is the median = mean value where
|
As an interesting aside, the DJIA's randomness is more random than a roulette wheel, but less random than a tossed die, or tossed coin.
So, our conclusion so far is that the shenanigans in executive suites really didn't create anything of significance in the durations of expansions and contractions of the DJIA. A look at the magnitude of the expansions and contractions of the DJIA would be in order:
    tsmath -l djia1900-2002 | tslsq -o | tsrunmagnitude >\
        djia.1900.01.02-2002.06.28.runmagnitude
    head -16377 djia1900-2002 | tsmath -l | tslsq -o | tsrunmagnitude >\
        djia.1900.01.02-1956.03.09.runmagnitude
    tail -11653 djia1900-2002 | tsmath -l | tslsq -o | tsrunmagnitude >\
        djia.1956.03.09-2002.06.28.runmagnitude

    tsmath -l djia1900-2002 | tsderivative | tsrms -p
    0.011026
    head -16377 djia1900-2002 | tsmath -l | tsderivative | tsrms -p
    0.012092
    tail -11653 djia1900-2002 | tsmath -l | tsderivative | tsrms -p
    0.009324
|
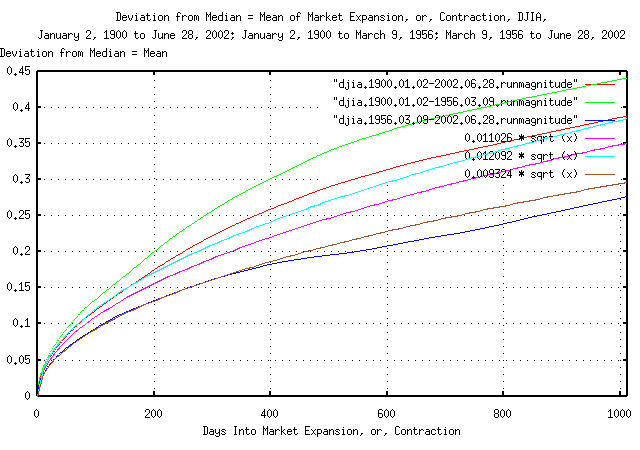
Figure III is a plot of deviation of the expansions and
contractions of the DJIA's Brownian motion/random walk equivalent from
its median = mean value for January 2, 1900 through June 28, 2002;
January 2, 1900 through March 9, 1956; and March 9, 1956 through June
6, 2002; and its theoretical values, (extrapolated from the daily
close data,) 0.011026 * sqrt (t),
0.012092 * sqrt (t), and
0.009324 * sqrt (t).
The interpretation of Figure III is that, measured over the
Twentieth Century, the deviation of the value of the DJIA's Brownian
motion/random walk equivalent from its median = mean value at 1012
days is around 0.4 = 40%. This means
that a thousand trading days from now, (about four calendar years,)
the value of the DJIA's Brownian motion/random walk equivilent would
be greater than 40% higher than its median value for one standard
deviation, about 16%, of the time, and about 16% of the time, about
40% lower.
So, our conclusion is that the shenanigans in executive suites really didn't create anything of significance in the magnitude of the expansions and contractions of the DJIA, either.
It would appear that there is little evidence that the shenanigans in the executive suites created the decline in the DJIA-the recent decline is well within expected values based on the history of the DJIA in the Twentieth Century. The decline would have happened with, or without the shenanigans, and is not out of the ordinary.
Not that such shenanigans should be condoned-they shouldn't. But they should not be the scapegoat for the normal dynamics of the markets, either.
Baseball is a game, and the rules of the game are arbitrary, (why 4 bases instead of 3, or 5?) Valuations of companies is an arbitrary game, too, based on heuristic benchmarks, i.e., based on intuitive arguments-as opposed to an axiomatic, formal science. But executives still have to play by the rules of the game.
So, can crooks in the executive suites of businesses manipulate valuations and create a market crash? The answer is probably not.
The analysis depends on the deviation, rms =
0.011026, and average, avg =
0.000175, of the daily marginal increments of the
DJIA's Brownian motion/random walk equivalent. At issue is the
relative magnitude of the numbers-a very small number rattling around
in a relatively large number. The rms
settles quite quickly. Not so for the
avg.
It can be shown that a Kalman
filtering technique, as used in the tskalman
program, to determine the avg is the
best that can be done for a given data set size. But is the best good
enough?
    tsmath -l djia1900-2002 | tsderivative | tsstatest -c 0.9 -e 0.0000175
    For a mean of 0.000175, with a confidence level of 0.900000
        that the error did not exceed 0.000017, 1073988 samples would be required.
        (With 28028 samples, the estimated error is 0.000108 = 61.834614 percent.)
    For a standard deviation of 0.011026, with a confidence level of 0.900000
        that the error did not exceed 0.000017, 536994 samples would be required.
        (With 28028 samples, the estimated error is 0.000077 = 0.694730 percent.)
What this means is that if we repeat the measurements on data sets
that are statistically identical to the DJIA, 5 times out of a
hundred, on average, we would measure the
avg to be less than
0.000175 - 0.000108 = 0.000067, and 5
times it would measure greater than 0.000175 + 0.000108
= 0.000283. Conversely, it would take over a million
daily closes to determine the avg to
within 10%.
There is additional analysis available for the DJIA. Quantitative Analysis of Non-Linear High Entropy Economic Systems I, answers the question Example II, Is the Equity Price Growth of the DJIA Component Companies Optimally Maximal? And, Quantitative Analysis of Non-Linear High Entropy Economic Systems III, Example I, the DJIA, analyzes the DJIA and the Crash of 1929.
--

John Conover, john@email.johncon.com, http://www.johncon.com/