| john@email.johncon.com |
| http://www.johncon.com/john/ |
|
|
|
||
Room Acoustics |
|||
Home | John | Connie | Publications | Software | Correspondence | NtropiX | NdustriX | NformatiX | NdeX | Thanks
|
Measurement microphones, (see: Using the Panasonic WM61A as a Measurement Microphone,) are an indispensable tool for measuring room acoustics. Much of this section will reference the outstanding course presentation, "PROJEKTKURS I ADAPTIV SIGNALBEHANDLING: Room Acoustics with associated fundamentals of acoustics," (its in English, and quite formal) and the section will present a heuristic/intuitive development and solution to the same standing wave equations for measuring the frequency response of room acoustics, including two example residential rooms. The Heuristic Development:Consider a listener, listening to a sound wave,
Which is Equation 2.63, Page 15, "PROJEKTKURS I ADAPTIV SIGNALBEHANDLING: Room Acoustics with associated fundamentals of acoustics," where:
Note that for for the first null; and a null will occur at integer
multiples of this frequency, (measured at a distance
Further, if another reflective wall is placed in front of
the listener, (that reflects the sound with 100% efficiency,
normal to the sound wave, i.e., there is no dissipation of
energy,) at a distance of As a heuristic, if another set of parallel reflective
walls, perpendicular to the first set of reflective walls,
But note that the range of applicability is below the
Schroeder cutoff frequency,
From Equation 3.28, Page, 28, "PROJEKTKURS I ADAPTIV SIGNALBEHANDLING: Room Acoustics with associated fundamentals of acoustics": where, from Equation 3.11, Page 21, "PROJEKTKURS I ADAPTIV SIGNALBEHANDLING: Room Acoustics with associated fundamentals of acoustics": and substituting: where Note that the derivation, above, assumed walls with no
energy loss, at any frequency, (not to mention that sound
intensity decreases with the square of the distance,
Empirical Verification:Two residential rooms will be analyzed, one of reasonable physical dimensions, (a den, with a typical HiFi sound system,) and another with nearly cubical physical dimensions, (a bedroom converted to an office with a near-field sound system.) The den has wallboard walls, brick fireplace, and wood
floors, in addition to furniture-all of which absorb
sound. Both wallboard and wood floors do not absorb sound at
very low frequencies, but do, (by about
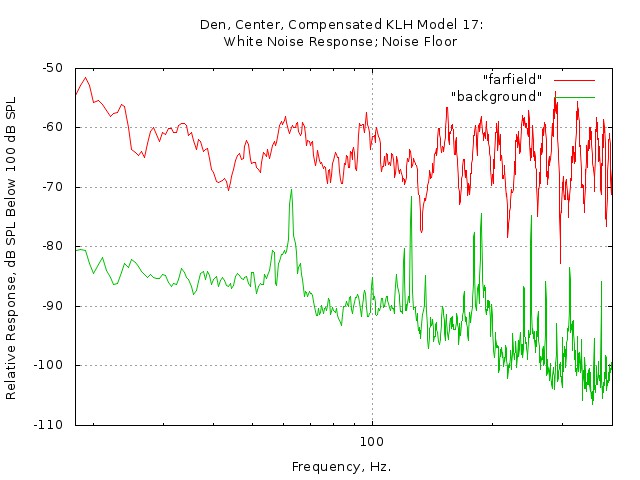
Figure I. Den Center Frequency ResponseFigure I is a plot of the frequency response of the den, measured in the center of the room, and the room noise floor. White noise was used as the signal source for the frequency response. Since a signal source with a flat frequency response was required, an acoustic suspension speaker was chosen, (KLH Model 17,) since the low frequency roll off response of closed box speakers is gentle and predictable. The speaker amplifier was driven by the whiteLF_sound(1) program from the sine_sound.tar.gz archive to linearize the response of the KLH speaker at low frequencies with the following STDIN commands:
          p 5.3
          g 0.006
          a 20.0
which provided a flat white noise sound signal, (approximately 40 dB gain at 5.3 Hz., over the flat band high frequency gain,) from the speaker for the analysis of the frequency response of the den. A measurement microphone and amplifier, as described in the Using the Panasonic WM61A as a Measurement Microphone page, was placed in the exact center of the room, and a Linux PC running the Baudline FFT time-frequency browser designed for scientific visualization of the spectral domain used to analyze and record the sound pressure level, (SPL,) signal at the room's center.
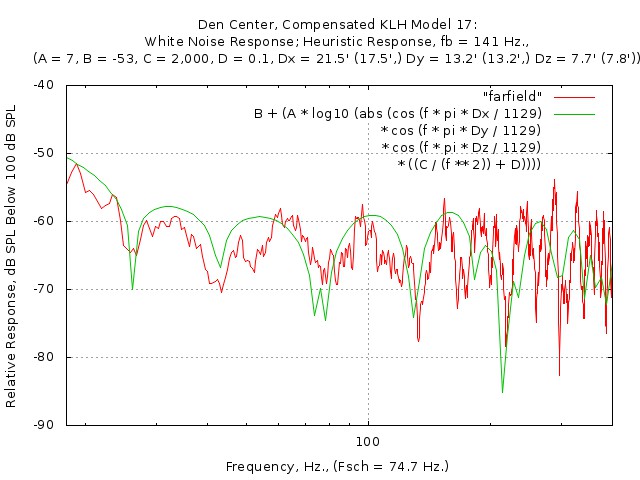
Figure II. Den Center Frequency Response and Heuristic Room ResponseFigure II is a plot of the frequency response of the den, overlayed with the heuristic/intuitive response of an empty room of similar dimensions and characteristics. The Schroeder cutoff frequency of the den is 74.7 Hz., (which is, approximately, the limit of the heuristic analysis' accuracy.) The office has wallboard walls and wood floors, in addition
to office furniture, (computer tables, printer stands,
bookshelfs, etc.,) all of which absorb sound. Both wallboard
and wood floors do not absorb sound at very low frequencies,
but do, (by about
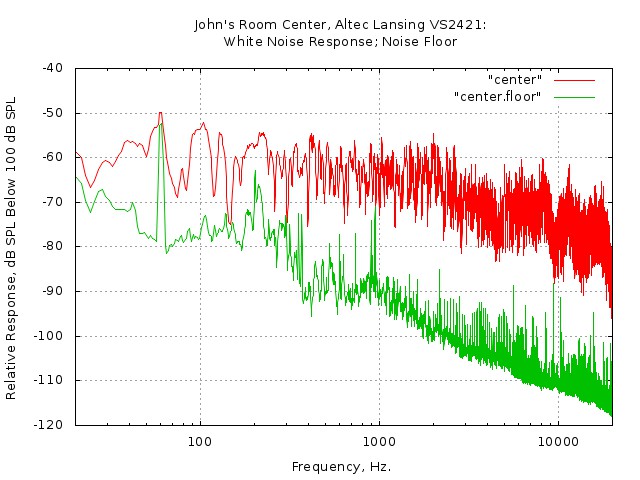
Figure III. Office Center Frequency ResponseFigure III is a plot of the frequency response of the office, measured in the center of the room, (the speaker frequency response was not compensated,) and the room noise floor. White noise was used as the signal source for the frequency response.
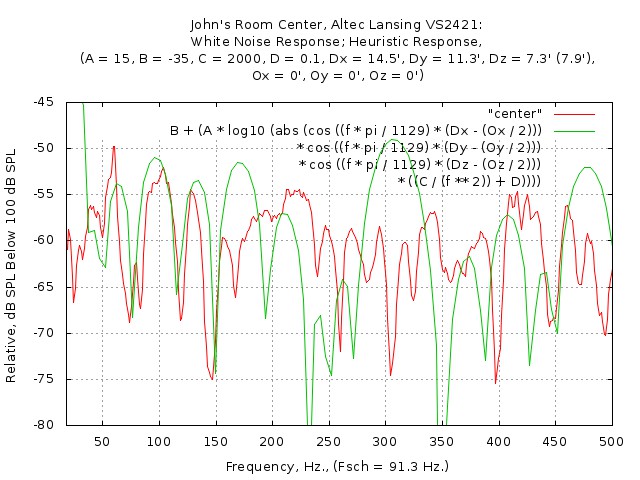
Figure IV. Office Center Frequency Response and Heuristic Room ResponseFigure IV is a plot of the frequency response of the office center, (the speaker frequency response was not compensated,) overlayed with the heuristic/intuitive response of an empty room of similar dimensions and characteristics. The Schroeder cutoff frequency of the den is 91.3 Hz., (which is, approximately, the limit of the heuristic analysis' accuracy.) There is a common misconception that the room response can be equalized. To demonstrate the fallacy:
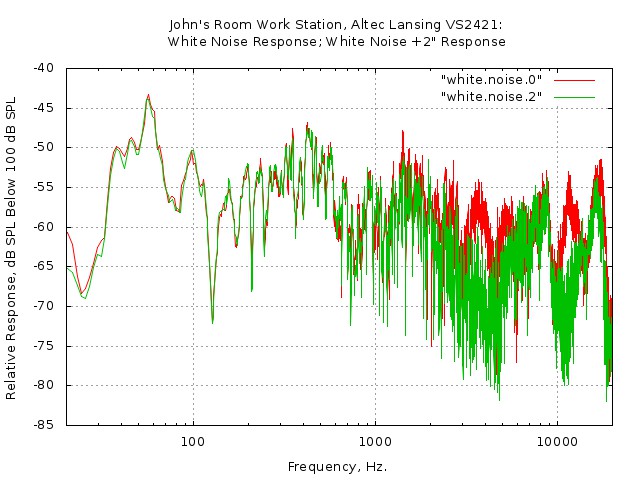
Figure V. Office Listener Position Frequency Response Overlayed with Moving the Microphone Two InchesFigure V is a plot of the frequency response of the office
at the listener's position, (about 2 feet in both the
Note that:
Addendum, Acoustic Measurments with White NoiseSquare Wave Calibration Signal:Suppose that a sound system is calibrated such that a 0
dBFS square wave signal, (i.e., peak readings of the square
wave signal are +32767 and -32768 for 16 bit data, where
A 0 dBFS square wave calibration signal produces the maximum power output of the sound system. For 85 dB SPL of the maximum power output of the sound
system, (i.e., 100 dB SPL for a square wave,) the signal must
be reduced by a factor of 15 dB, and, Inexpensive sound level meters low pass filter the
rectified signal received to produce the mean of the signal,
Vmean, which is the same as the RMS, Root Mean Square, value
of the signal, The actual average rectified sound level meter reading is
correct, (but may be multiplied by a conversion factor of
Sine Wave Calibration Signal:Suppose that a sound system is calibrated such that a 0 dBFS sine wave signal, (i.e., peak readings of the sine wave signal are +32767 and -32768 for 16 bit data, where2^16 = 65536,) then the RMS,
Root Mean Square, of the sine wave signal would be
32767.5 / sqrt (2) =
        23170.12145253019600583234
, corresponding to
the maximum output sine wave signal level.
A 0 dBFS sine wave calibration signal produces 1
/ sqrt (2) = 0.70710678118654752440 =
-3.01029995663981195215 dBFS of the maximum
power output of the sound system, (which is the defacto
reference "standard" of the industry.)
For 85 dB SPL of the maximum power output of the sound system,
(i.e., 100 dB SPL for a square wave,) the signal must be
reduced by a factor of 15 -
3.01029995663981195215 = 11.98970004336018804785
dB, and,
10^(11.98970004336018804785 / 20) = pow (10,
        11.98970004336018804785 / 20) =
        3.97635364383525332586
, or the signal should
be multiplied by a factor of 1 /
3.97635364383525332586 =
0.25148668593658708166.
Inexpensive sound level meters low pass filter the
rectified signal received to produce the mean of the signal,
Vmean, and then multiply this value by a conversion factor to
obtain the RMS, Root Mean Square, value of the signal,
which is the value of the conversion factor for a low pass filtered rectified sine wave calibrated sound level meter. Uniformly Distributed White Noise Calibration Signal:Suppose that a sound system is calibrated such that a 0
dBFS uniformly distributed white noise signal, (i.e., peak
readings of the uniformly distributed white noise signal are
+32767 and -32768 for 16 bit data, where The mean of a uniform distribution, (i.e., white noise,)
bounded on the interval a to b, with a probability density
function of And, the variance around the mean: where the standard deviation around the mean is: which is the RMS, Root Mean Square, of the noise signal, and, substituting: A 0 dBFS uniformly distributed white noise calibration
signal produces For 85 dB SPL of the maximum power output of the sound
system, (i.e., 100 dB SPL for a square wave,) the signal must
be reduced by a factor of Inexpensive sound level meters low pass filter the
rectified signal received to produce the mean of the signal,
which is the variance of the elements around the mean of 16383.75, or: which is the standard deviation of the elements around the
mean of 16383.75. Adding the two values together, Root Mean
Square, to obtain the RMS, Root Mean Square, value of the
signal, The actual average rectified sound level meter reading is correct, (but may be multiplied by a conversion factor of 1.11072073453959156175 if the meter is calibrated to present values for sine wave RMS, Root Mean Square.) Notes, Acoustic Measurments with White Noise[1] EBU R68-2000 states that:
[2] EBU R89-1997 states that:
[3] Although its rather convoluted, it appears that the level on a CD should be -18 dBFS, where 0 dBFS is the peak value of a sine wave, (EBU R68-2000,) and -15 dBFS, where 0 dBFS is the RMS value of a sine wave with a peak value of 0 dBFS, (EBU R89-1997.) Note the confusion: is the program level -15 dB below 0 dBFS, or -18 dB below dBFS? The industry's common "standard" for the maximum power output is a sine wave with instantaneous peaks of 0 dBFS. However, using a standard of a square wave of 0 dBFS is not ambiguous-which is what was used in this derivation. LicenseA license is hereby granted to reproduce this design for personal, non-commercial use. THIS DESIGN IS PROVIDED "AS IS". THE AUTHOR PROVIDES NO WARRANTIES WHATSOEVER, EXPRESSED OR IMPLIED, INCLUDING WARRANTIES OF MERCHANTABILITY, TITLE, OR FITNESS FOR ANY PARTICULAR PURPOSE. THE AUTHOR DOES NOT WARRANT THAT USE OF THIS DESIGN DOES NOT INFRINGE THE INTELLECTUAL PROPERTY RIGHTS OF ANY THIRD PARTY IN ANY COUNTRY. So there. Copyright © 1992-2015, John Conover, All Rights Reserved. Comments and/or problem reports should be addressed to:
|
Home | John | Connie | Publications | Software | Correspondence | NtropiX | NdustriX | NformatiX | NdeX | Thanks